Vaccination Coverage in Karnataka
We provide extensive data for COVID-19 Vaccination coverage in districts of Karnataka and Karnataka as whole. Three doses vaccination has been performed: Dose1, Dose2 and Precaution Dose.
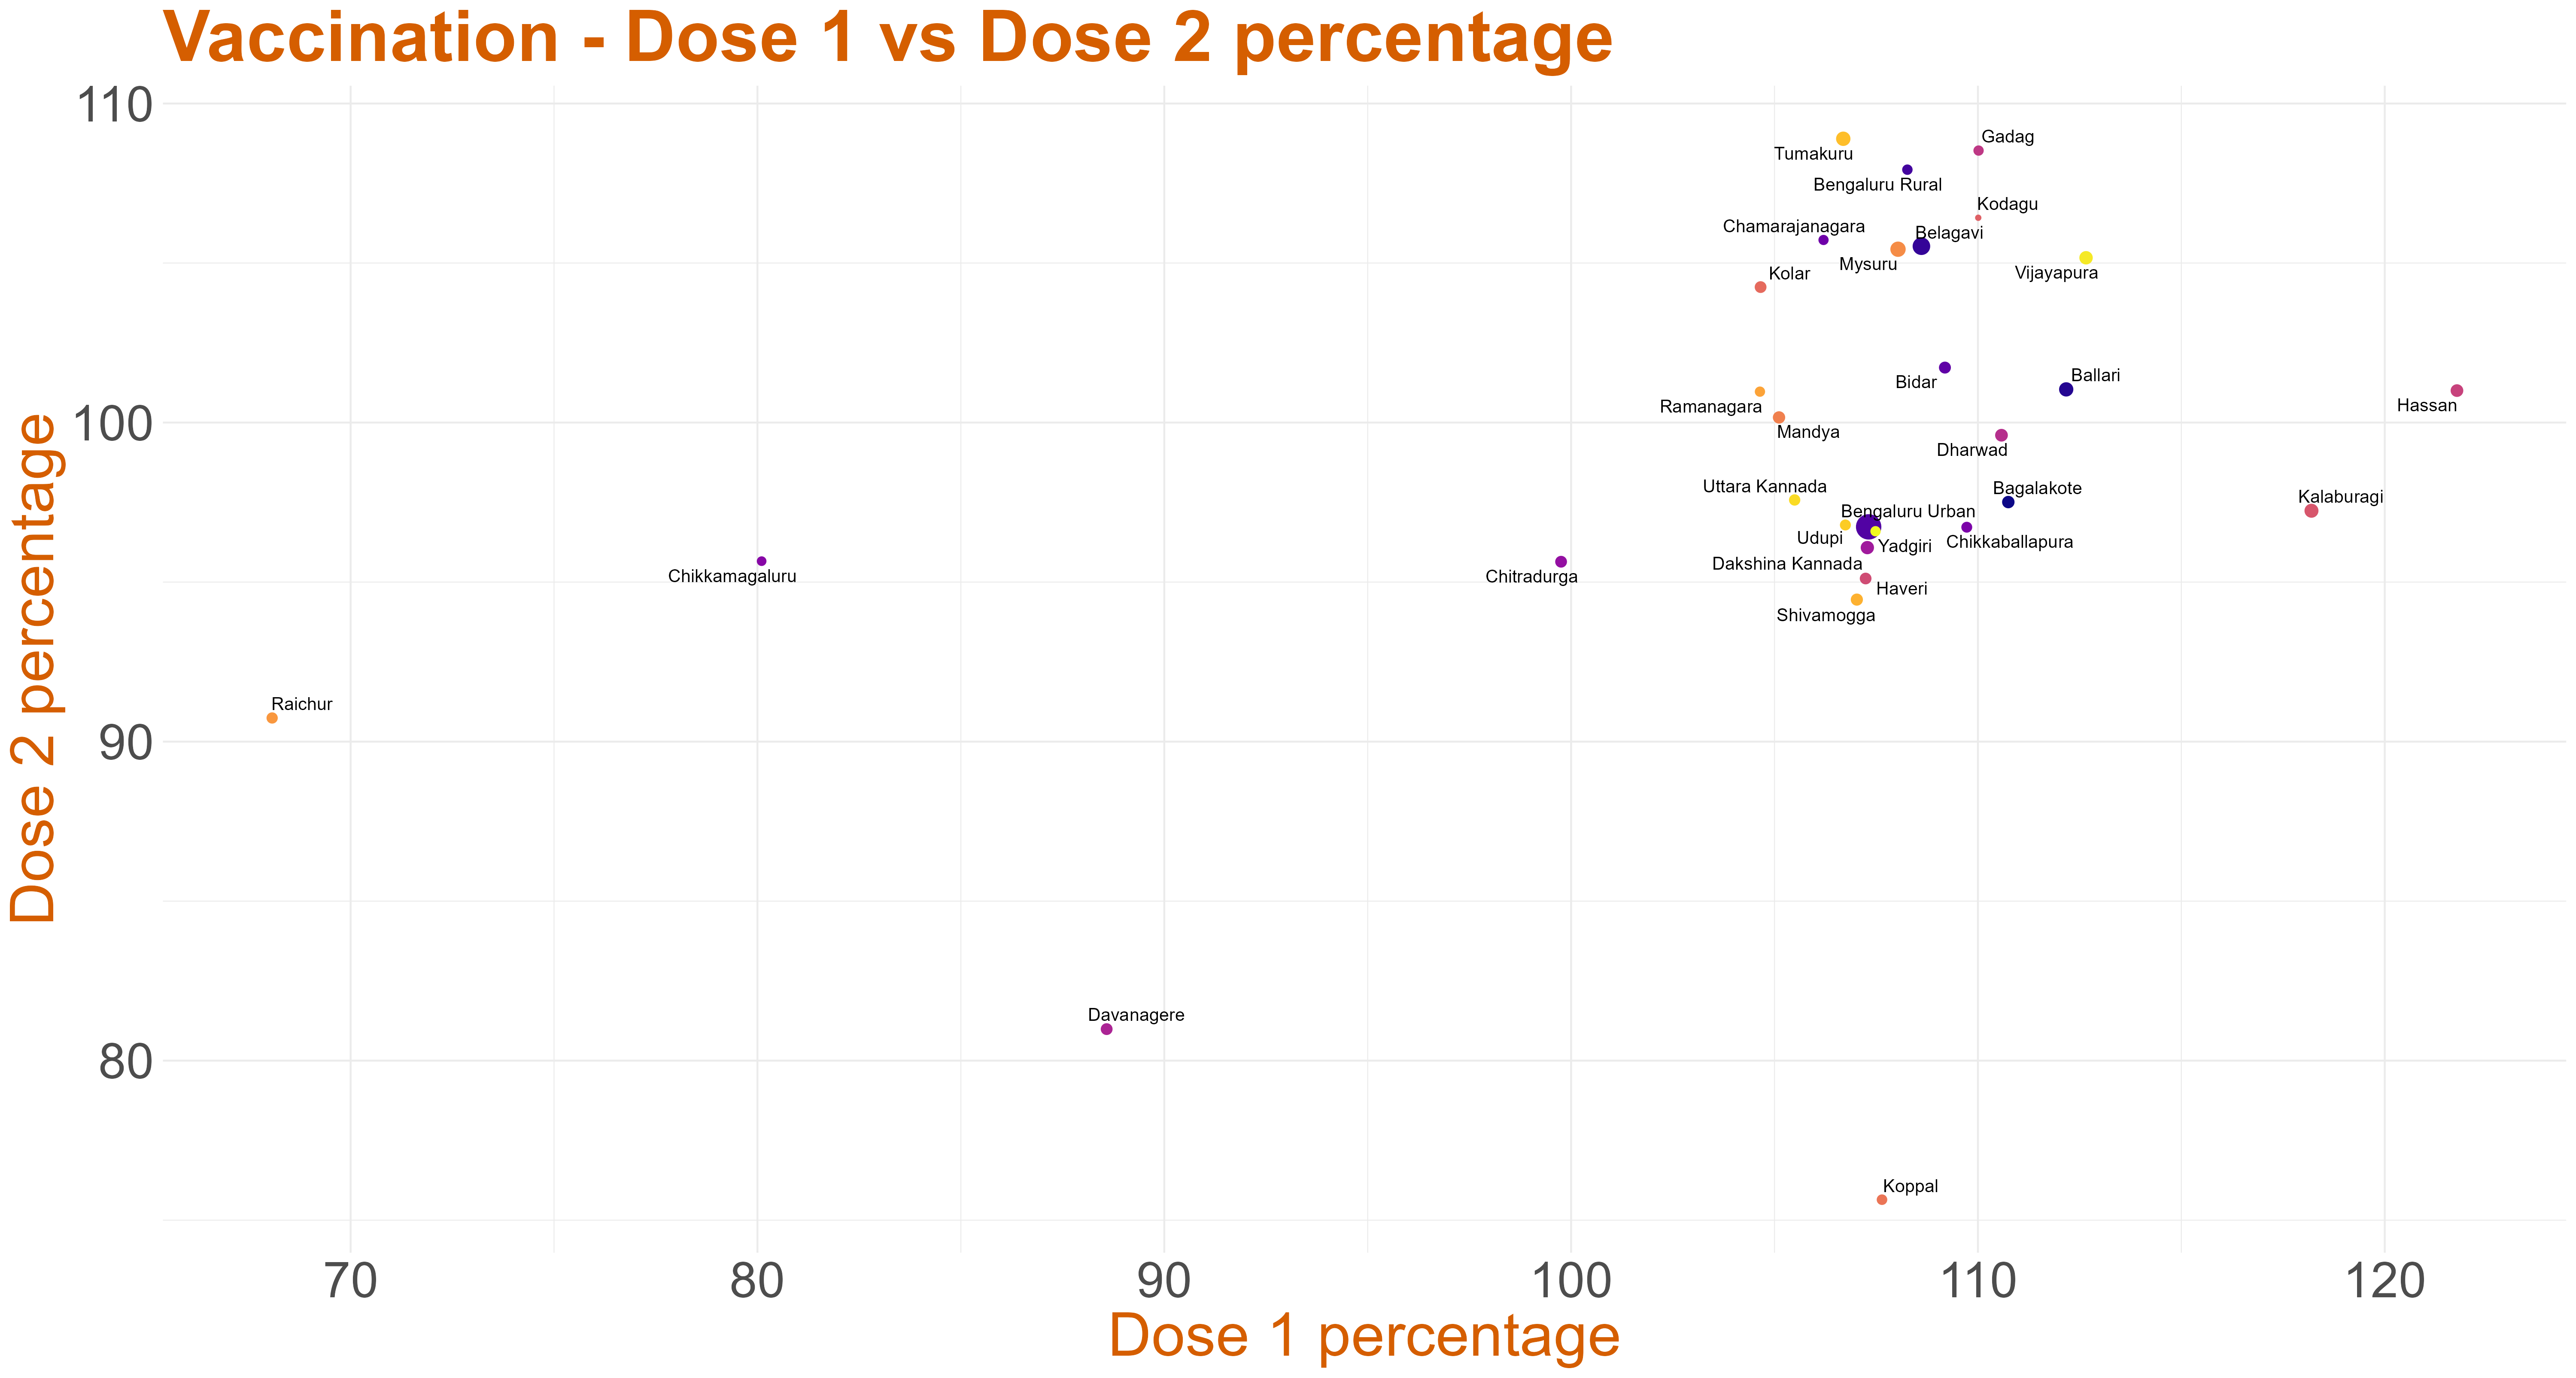
Vaccination - Dose 1 Vs Dose 2 Percentage
The plot compares the percentage of the population that has received the first dose of the COVID-19 vaccine to those who have received the second dose. The x-axis represents the percentage of people who have received the first dose, while the y-axis shows the percentage of those who have completed the vaccination regimen with the second dose. This plot effectively visualizes the progress of the vaccination campaign, highlighting the gap between the initial and full vaccination coverage. It helps in understanding the overall vaccination uptake and the rate at which people are returning for their second dose.
Dose 1 Data
These plots show the progression of the COVID-19 vaccination campaign in terms of the first dose administered. The x-axis represents the dates, giving a timeline of the vaccination rollout, while the y-axis indicates the total number of first dose vaccinations administered. Click here to see the graphs for all districts.
Dose 1, Dose2 and Precaution Dose Percentage
All the graphs below provide the cumulative dose 1, dose 2 and precaution dose vaccination percentage for each district. The dose 1 and 2 counts of BBMP district, if present, were added to Bengaluru Urban. Click here to see the graphs for all districts.