Infected Cases in India
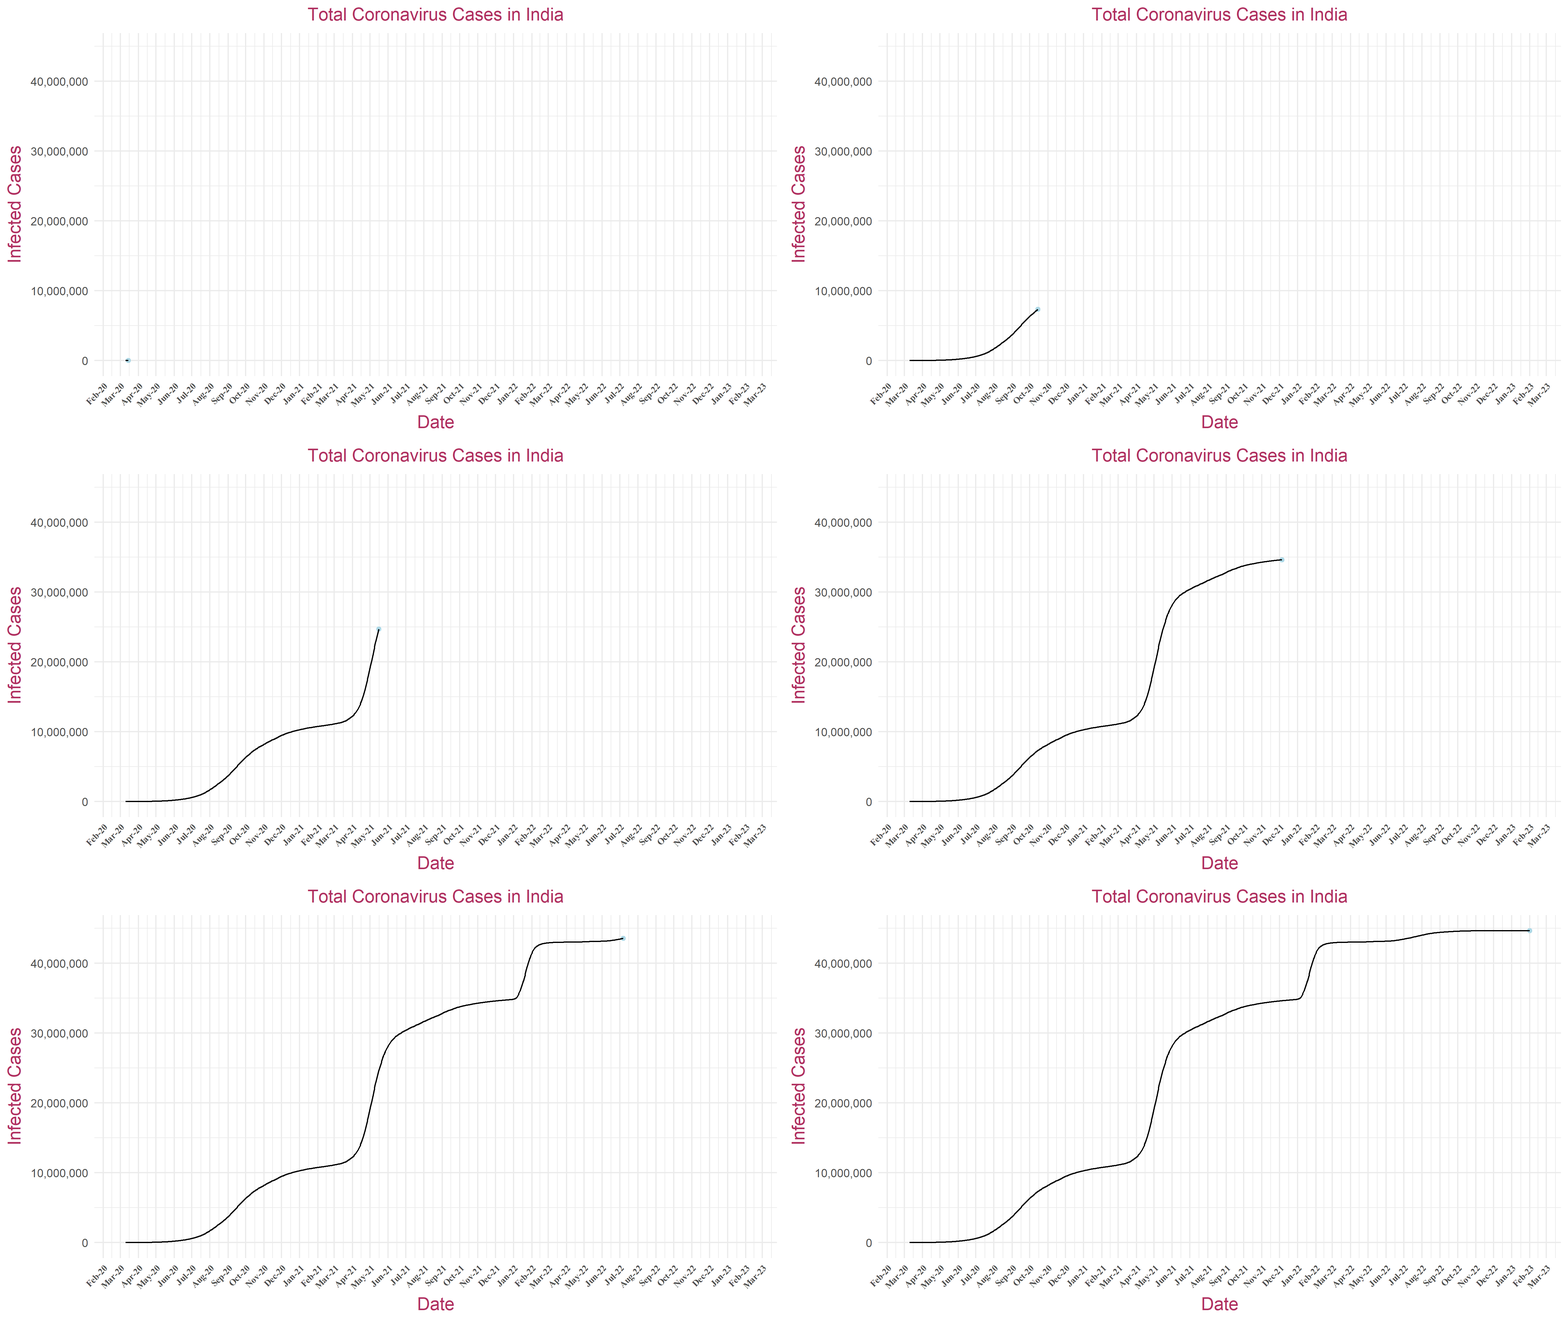
It provides a comprehensive overview of the total COVID-19 infections in the country, featuring two distinct plots. The first type of plot showcases the total number of infected cases in India over time and the second type of plot presents the same data but with a logarithmic scale on the y-axis, offering a different perspective by compressing large numerical ranges and emphasizing changes in growth rates. Together, these plots serve as invaluable tools for understanding the magnitude and progression of the COVID-19 outbreak in India.
Total Infected Cases in India
The plot showcases the cumulative count of COVID-19 infections across India over time. With dates along the x-axis marking the progression of time, and the y-axis denoting the total number of infected cases, this visualization offers a comprehensive view of the pandemic's spread throughout the country. Click here to see the graphs for each state.
Log Scale - Total Infected Cases in India
This plot presents a logarithmic representation of the cumulative COVID-19 cases in India over time. On the x-axis, dates are marked to denote the progression of the pandemic, while the y-axis displays the number of infected cases on a logarithmic scale. This transformation allows for a clearer visualization of the growth trajectory of the pandemic, especially during periods of exponential increase. By compressing the scale for larger values, the plot aids in discerning patterns and trends in the spread of the virus that may not be as evident on a linear scale. Click here to see the graphs for each state.

