Infected Cases in Karnataka
We provide a comprehensive overview of the COVID-19 situation in the state through various plots. It includes a plot of infected cases displayed in both normal and logarithmic scales, allowing for an in-depth analysis of the growth pattern and rate of infection. Additionally, an area graph illustrates the distribution of active, recovered, and deceased cases over time within a single graph. This section is designed to give a clear and detailed understanding of the progression and current status of COVID-19 in Karnataka, highlighting the dynamics between active cases, recoveries, and fatalities.
Total Infected Cases in Karnataka
The plot showcases the cumulative count of COVID-19 infections across India over time. With dates along the x-axis marking the progression of time, and the y-axis denoting the total number of infected cases, this visualization offers a comprehensive view of the pandemic's spread throughout the state.
Total Infected Cases in Karnataka
The plot presented as an area graph, provides a comprehensive overview of COVID-19 cases across various categories over time. The x-axis delineates dates, offering a chronological perspective, while the y-axis captures the cumulative numbers of active, recovered, and deceased cases. This visualization encapsulates the trajectory of the pandemic in Karnataka, offering insights into the progression of active cases, recoveries, and unfortunate fatalities. The area graph format enables viewers to easily discern the relative proportions of each category and track changes in their distribution over time.

Total Infected Cases for Districts in Karnataka
The plot showcases the cumulative number of COVID-19 cases across different districts in Karnataka over time. This plot enables viewers to compare the severity of the outbreak in different regions and track the progression of infections over time. Click here to see the graphs for each district.
Log scale - Total Infected Cases for Districts in Karnataka
The plot utilizes a logarithmic scale to illustrate the cumulative number of COVID-19 cases across various states in India over time. Click here to see the graphs for each state.
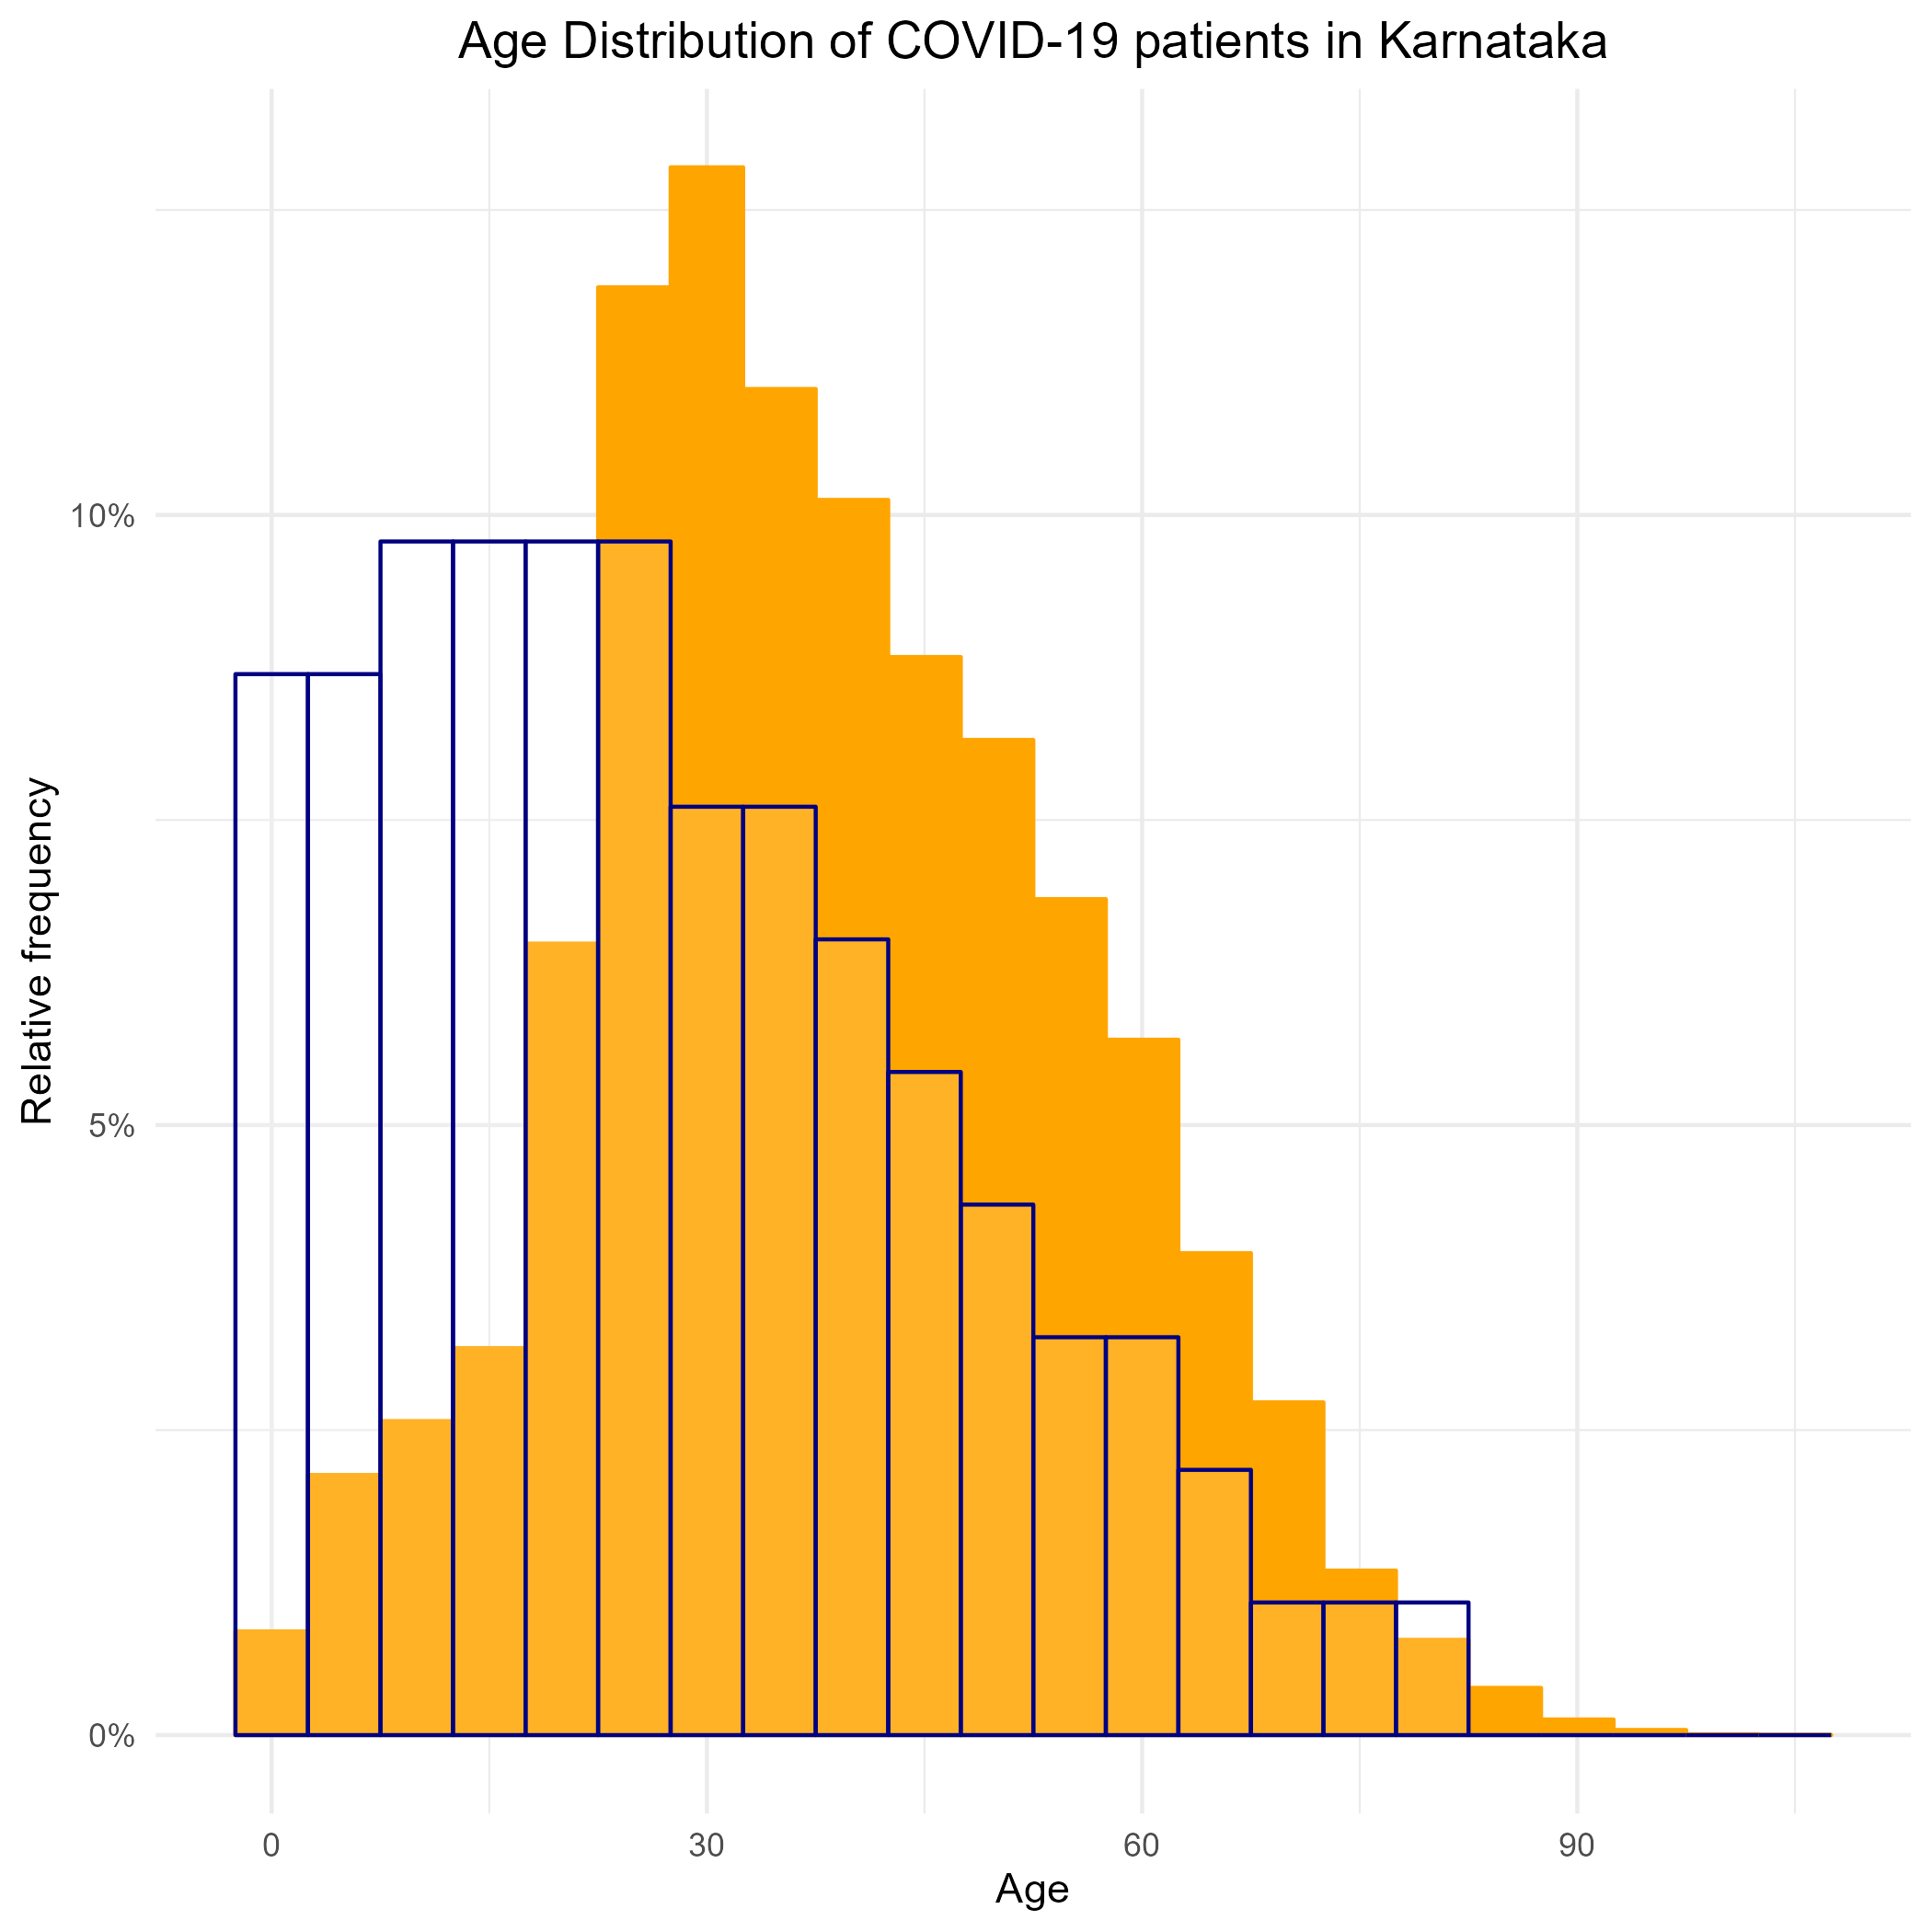
Age Distribution of COVID-19 Patients in Karnataka
It is important to understand how the virus affects different age groups in the population.
Towards this we present a graph of the age distributions for the COVID-19 patients in Karnataka
with along with the distribution of the entire population of Karnataka [data taken from the 2011 census].
The filled in orange color indicates the distribution of the coronavirus patients in Karnataka and the navy
outline represents the Age distribution of the entire population of Karnataka for reference. Out of all the cases,
three have unknown ages. Medical practitioners may be interested in knowing how the virus is affecting the people
across age groups, whether or not it is affecting different age groups differently.
It is seen that the distribution of the coronavirus patients has a higher fraction of the patients among the range of
ages in 20-35 and not too many in the range 0-20, when compared to the demographic in Karnataka. A possible reason for
this might be that imported cases, i.e. due to travel abroad, were due to travel of working professionals. The state
also took steps quite early on to lock down schools and universities to prevent the younger segment of the population to be affected.
Those in the age group of 0-15 are primary or secondary contacts of those who have some sort of travel history to COVID-19 affected
locations.
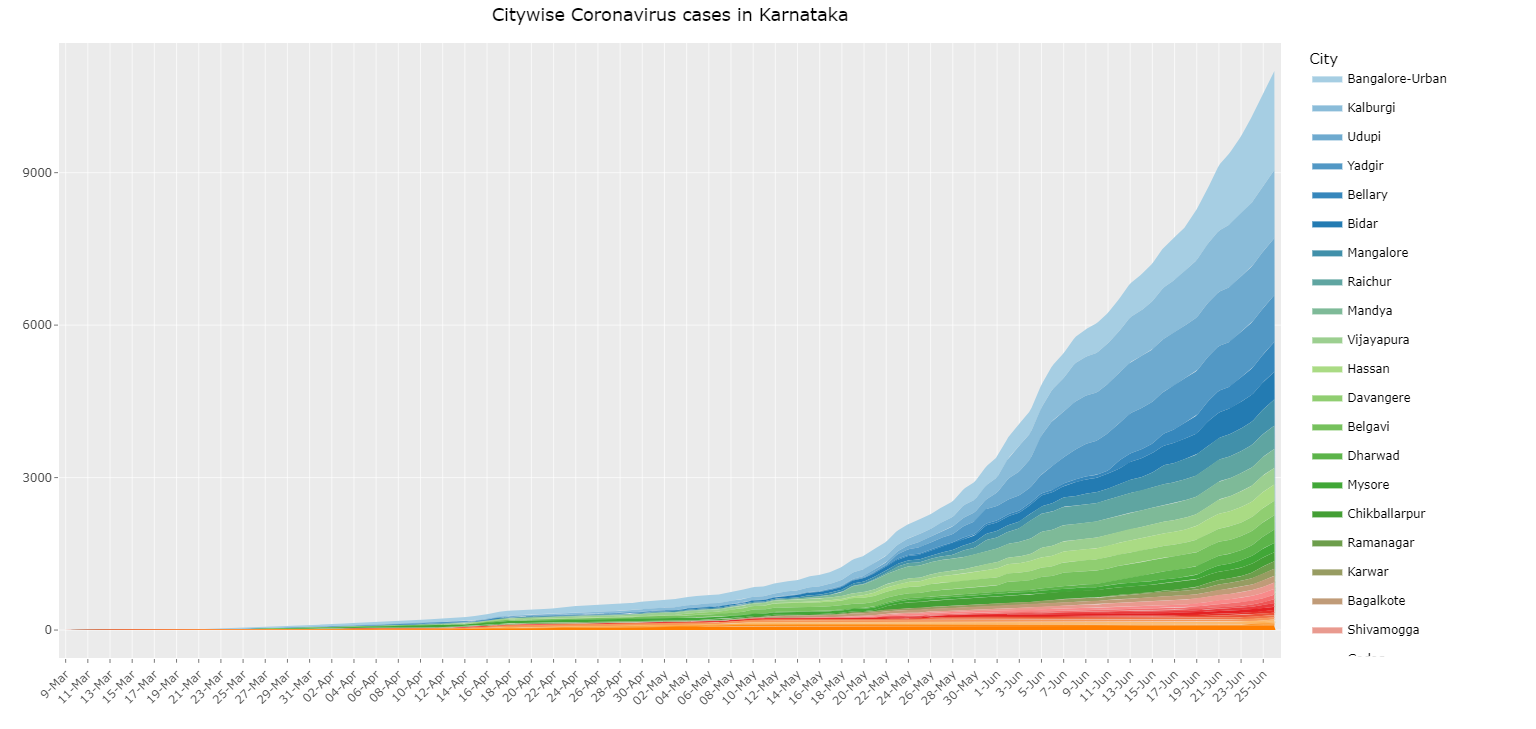
Distribution across Cities in Karnataka
We present observable timeline of the distribution of total number of infections in Karnataka across the cities. The graph, presented here is a continuous analog of a stacked bar chart. It is used here to show how the composition of the total Coronavirus cases in Karnataka varies across the different cities. The growth in area of each color over time represents the corresponding increase in the number of Coronavirus cases for that city.