Dose 1, Dose2 and Precaution Dose Percentage
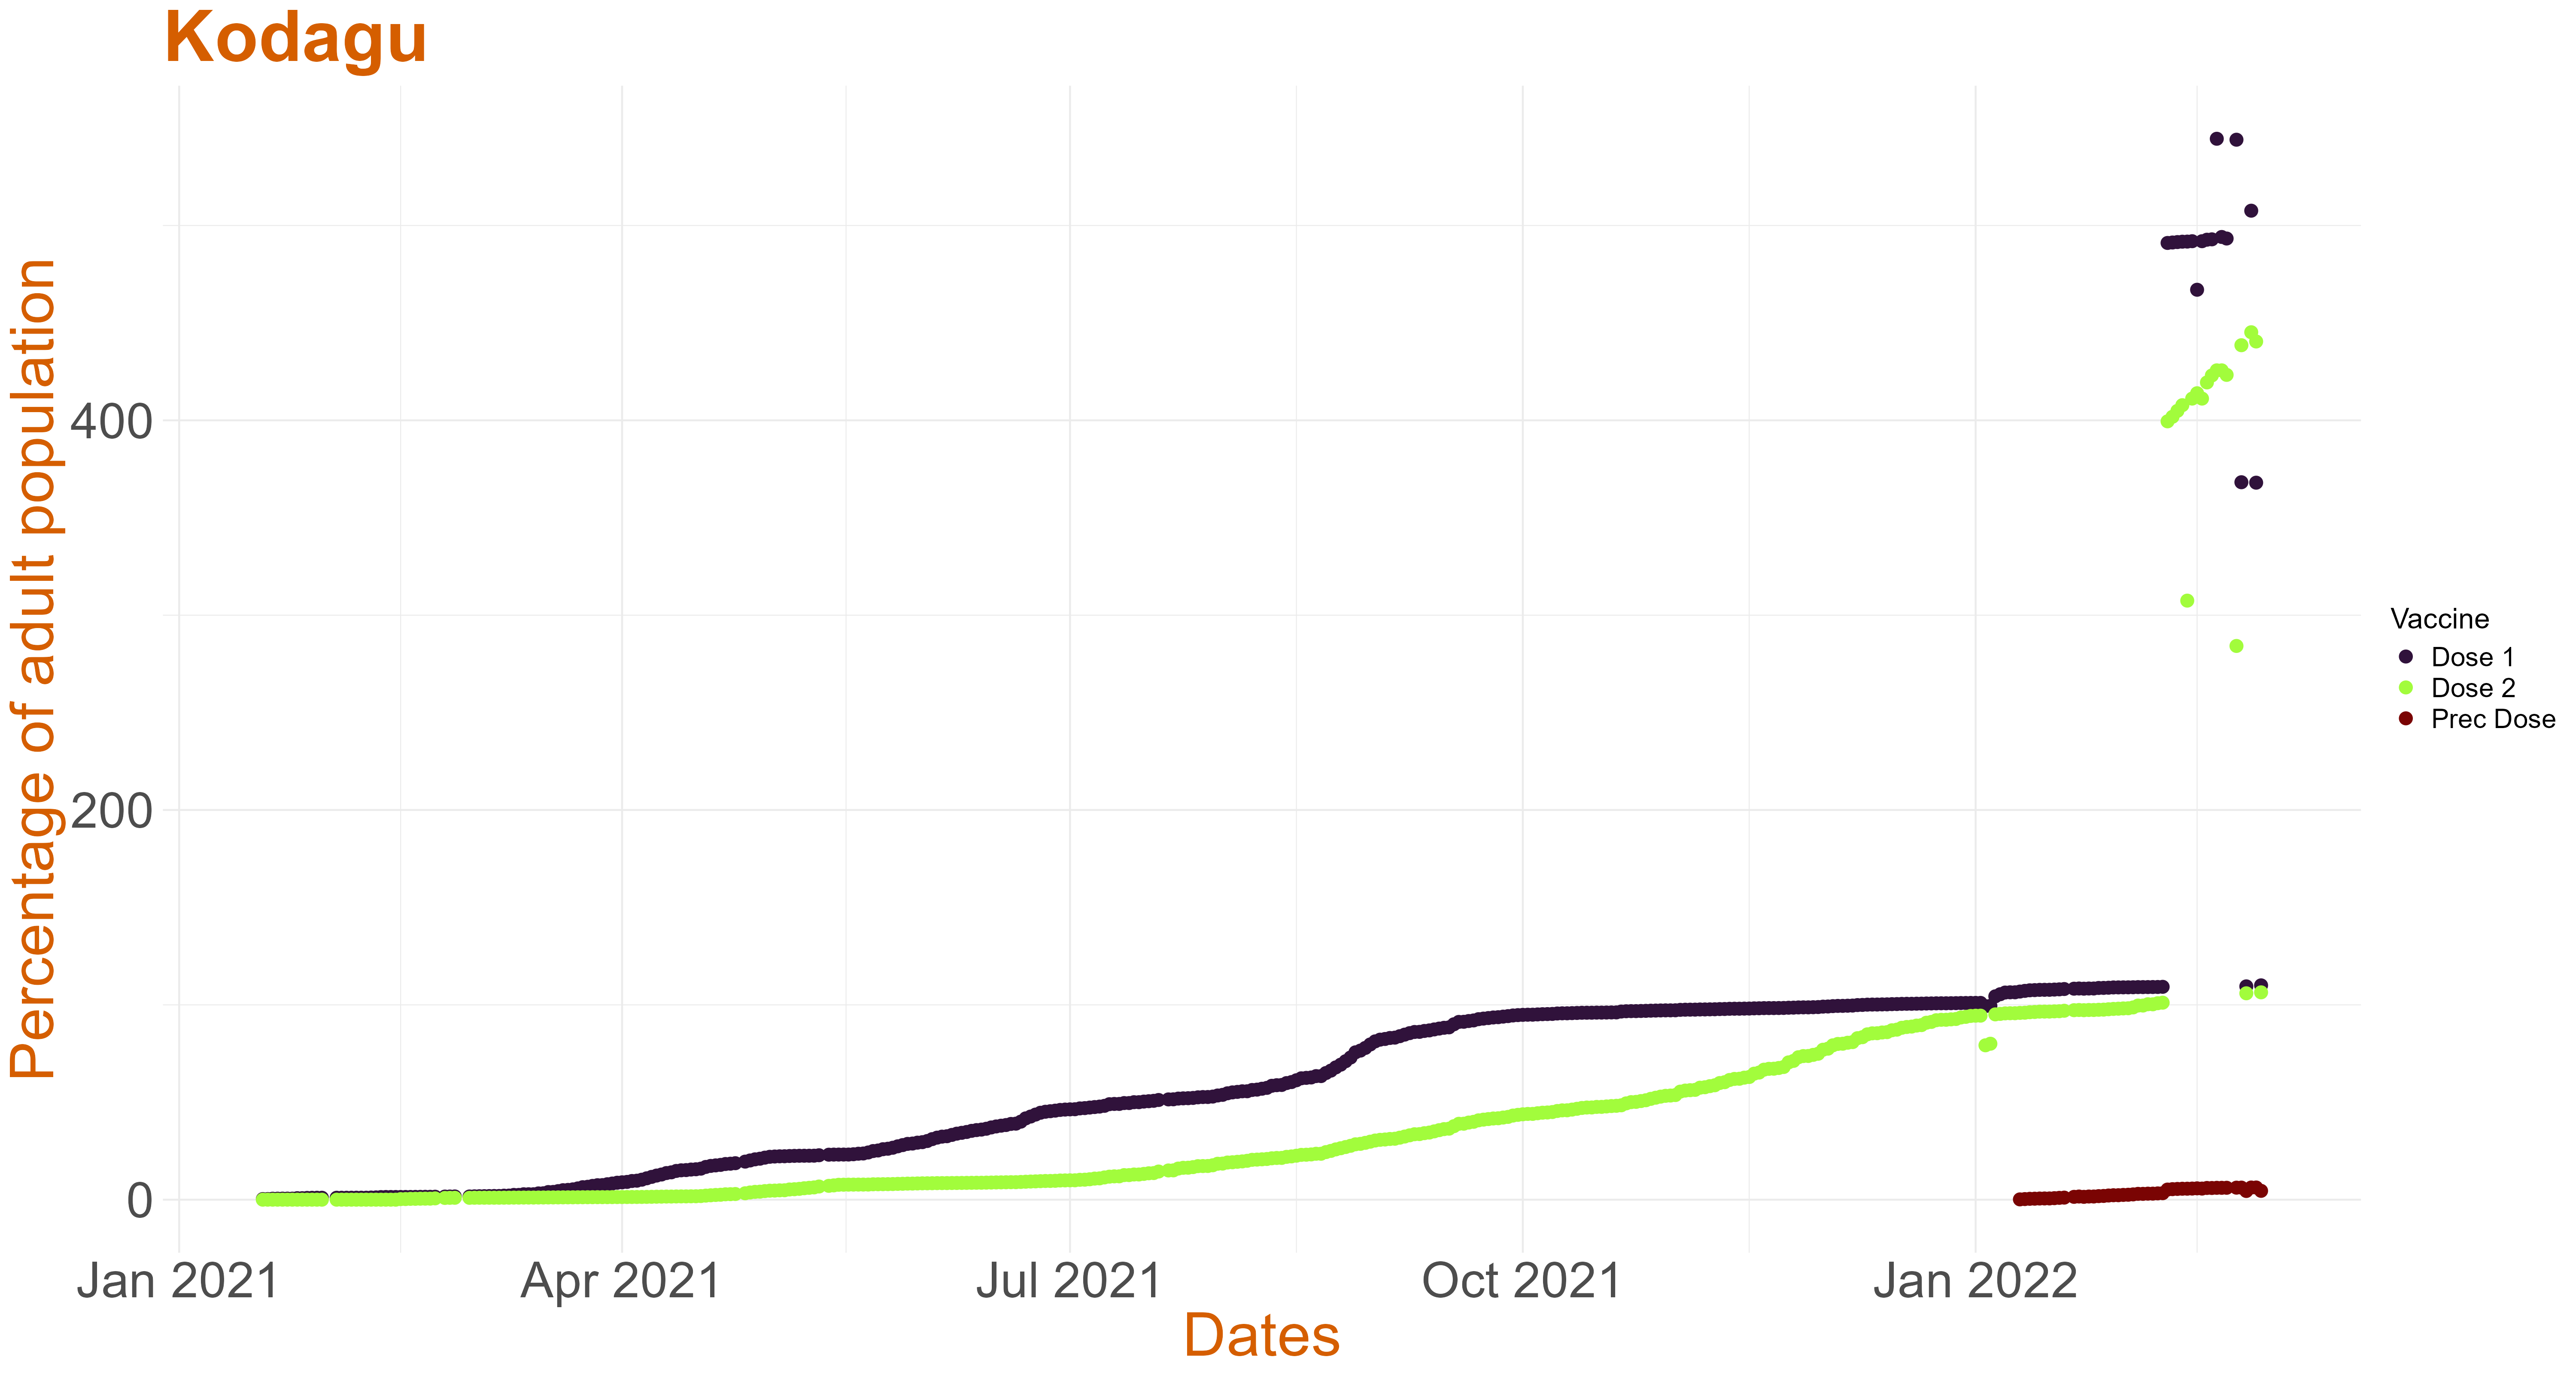
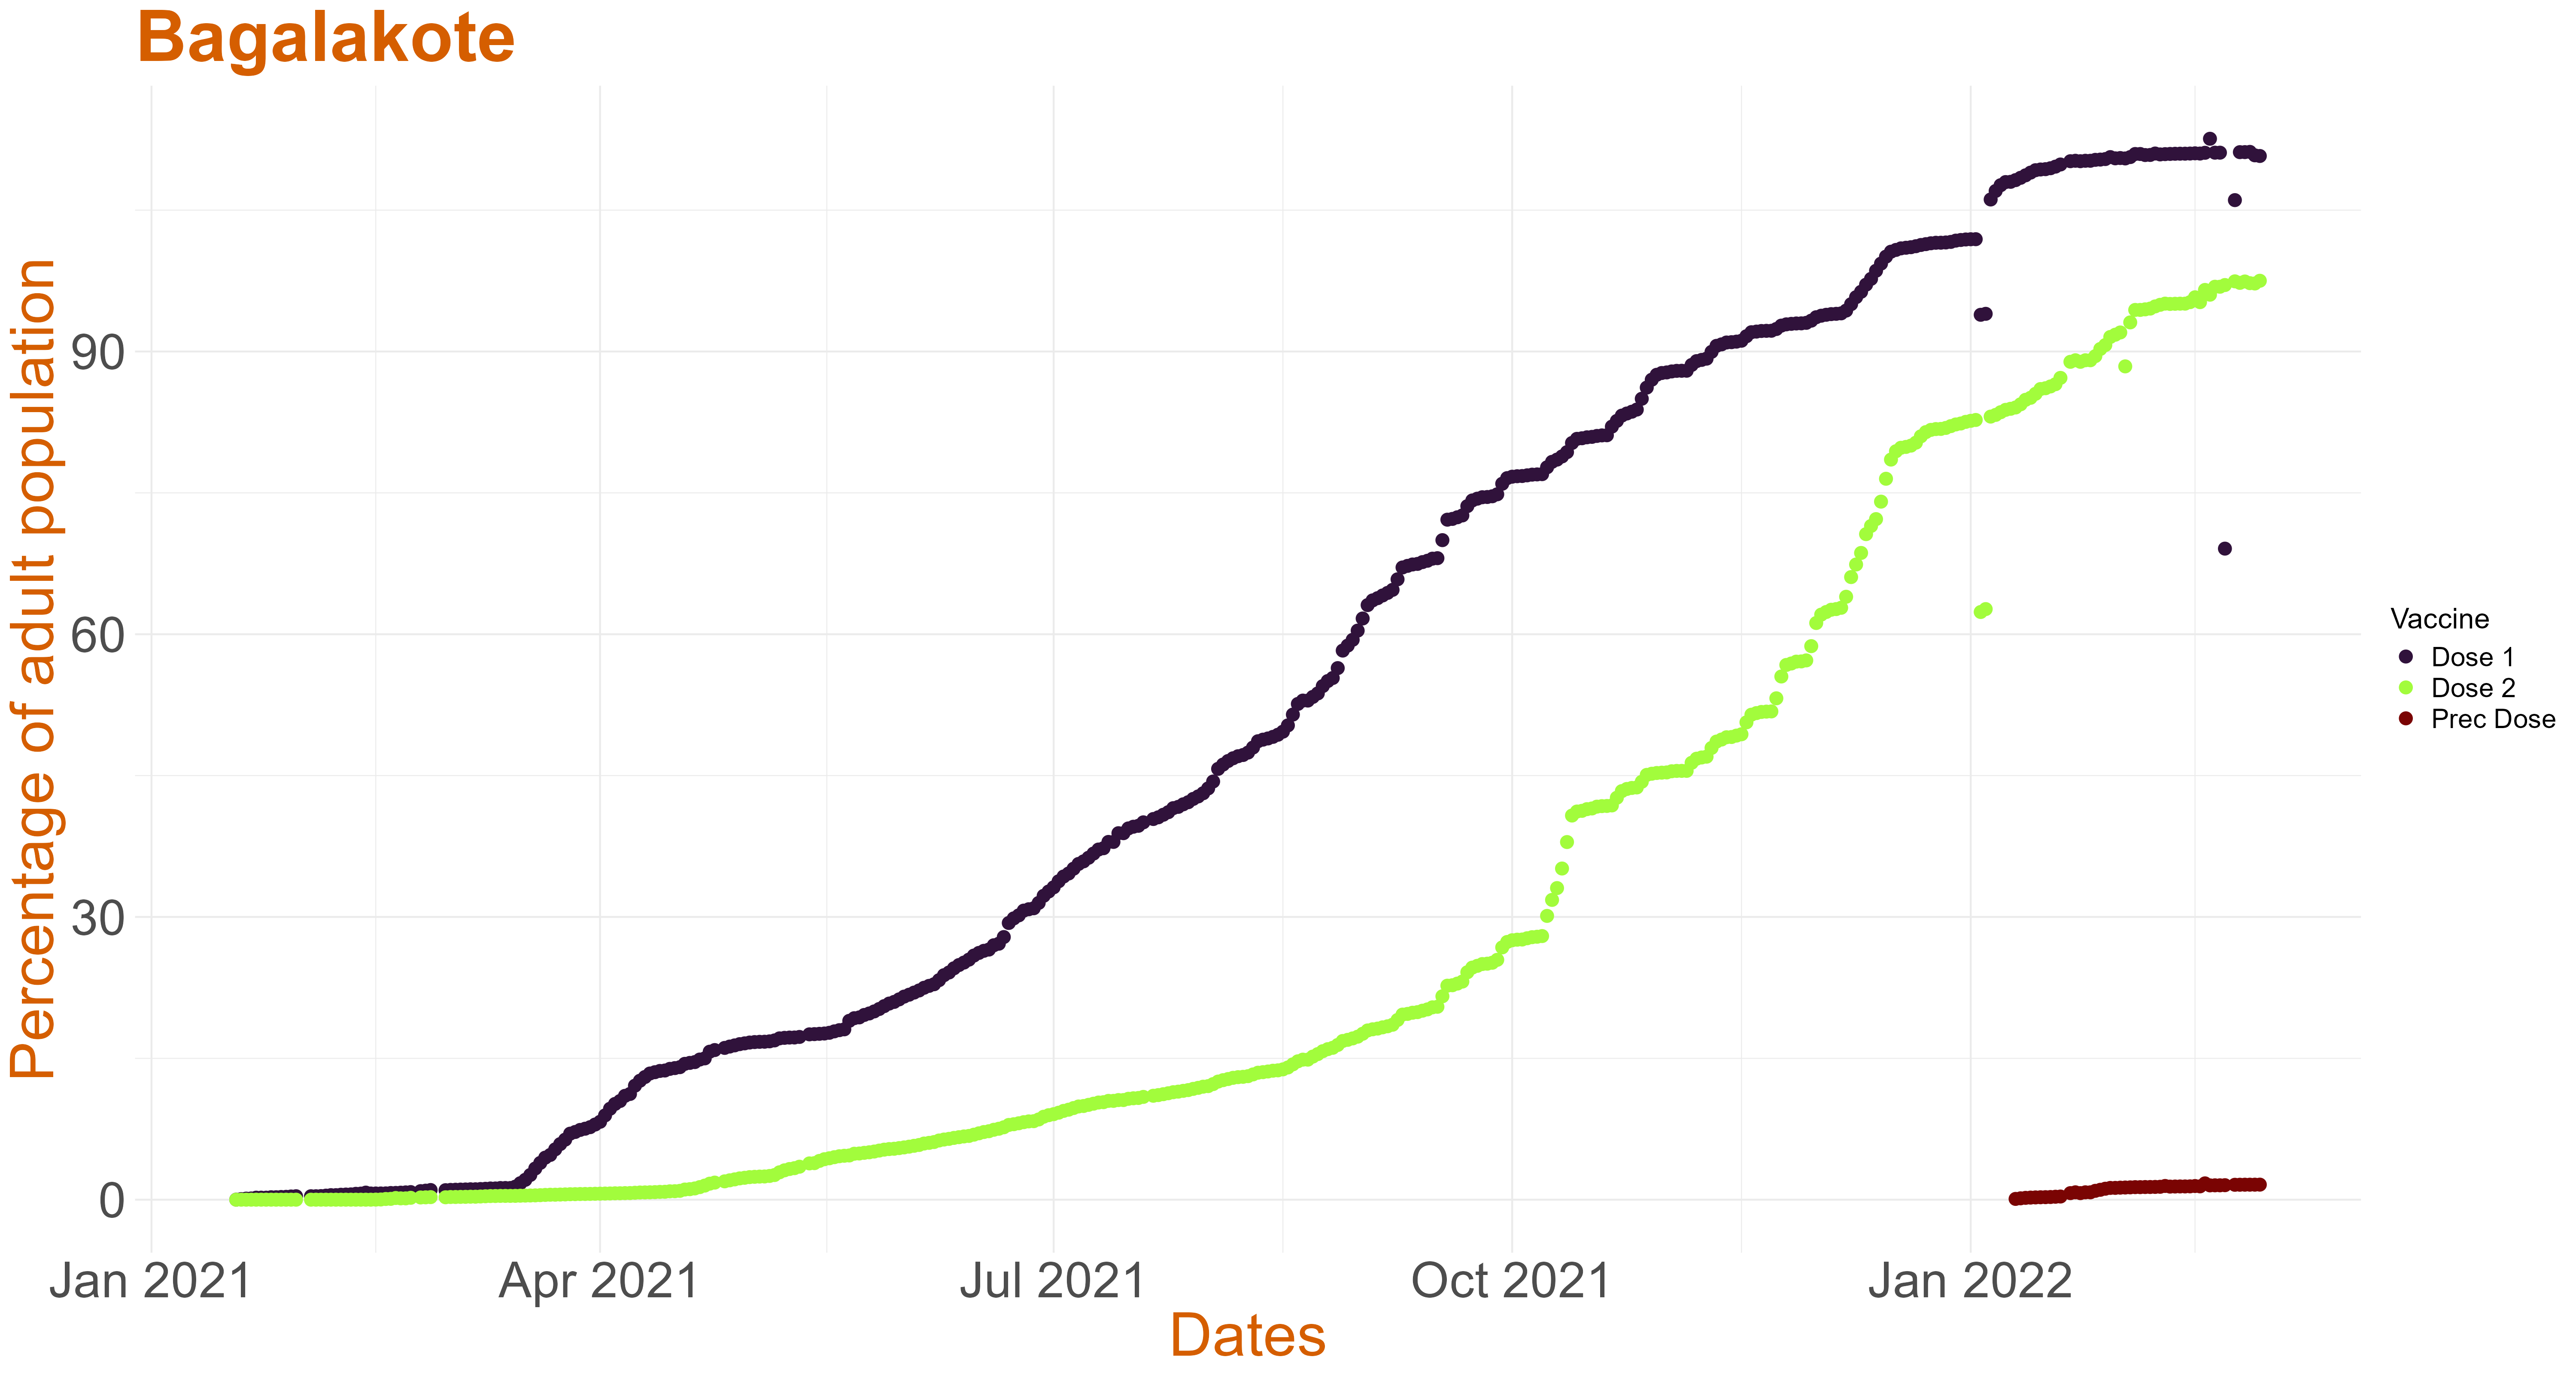
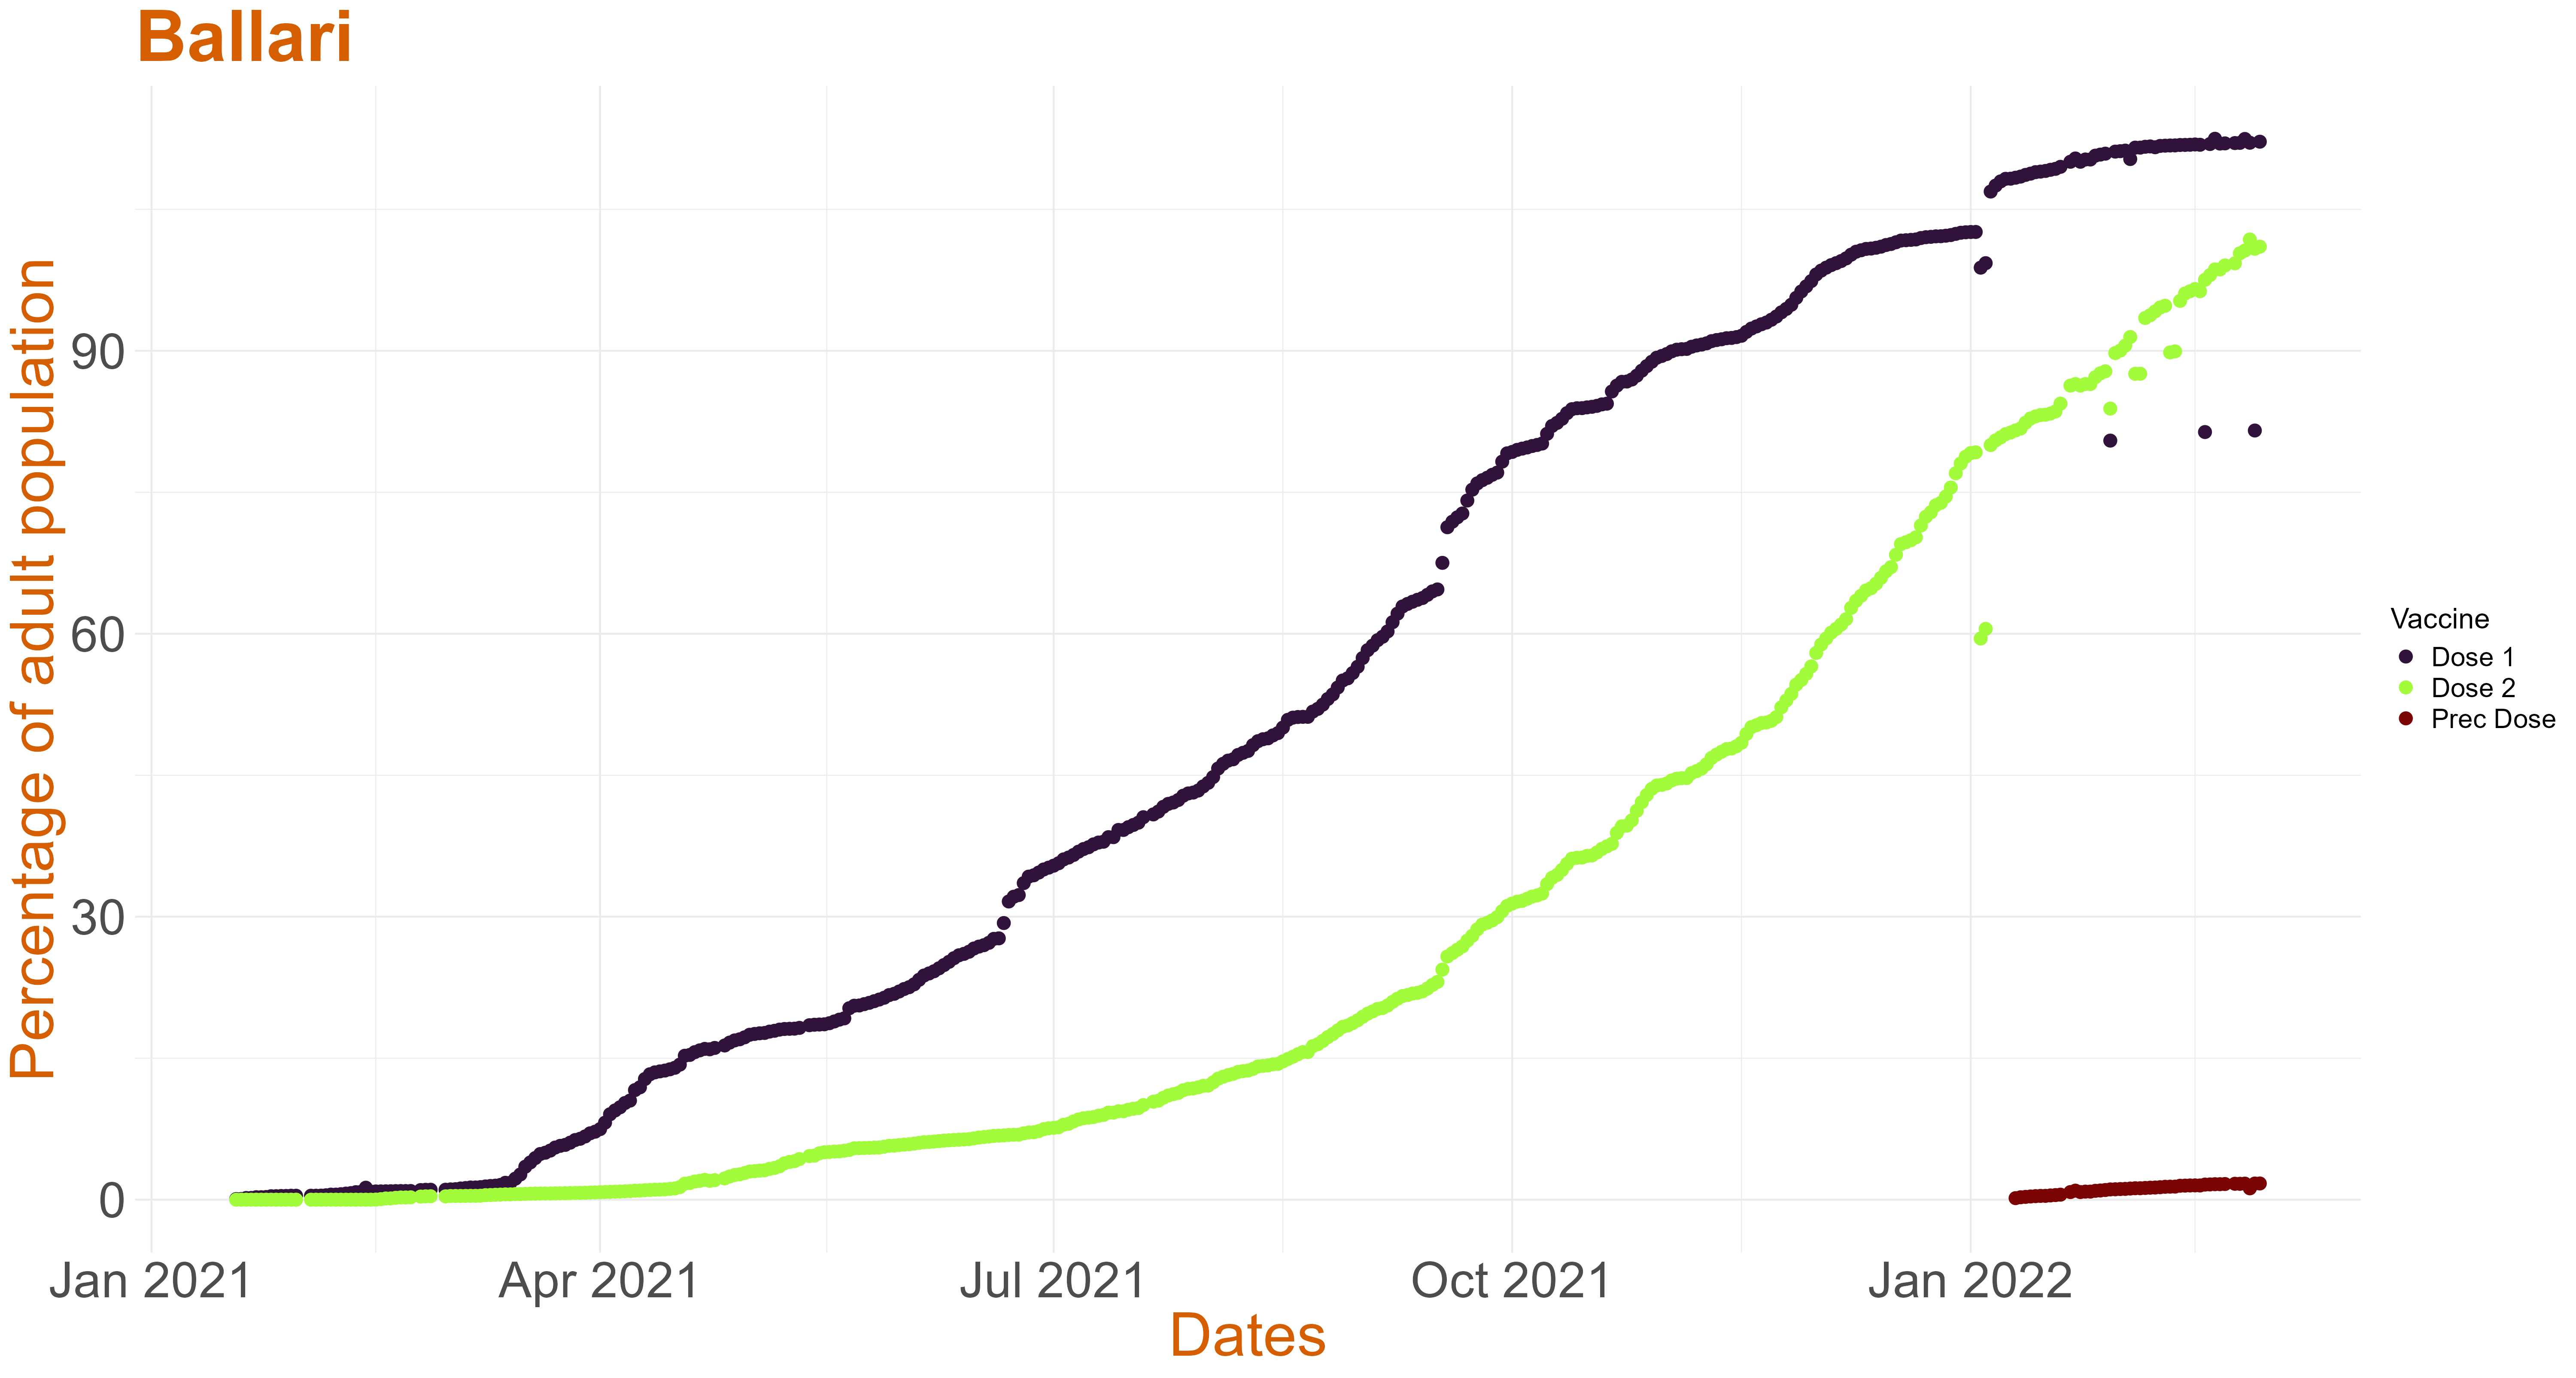
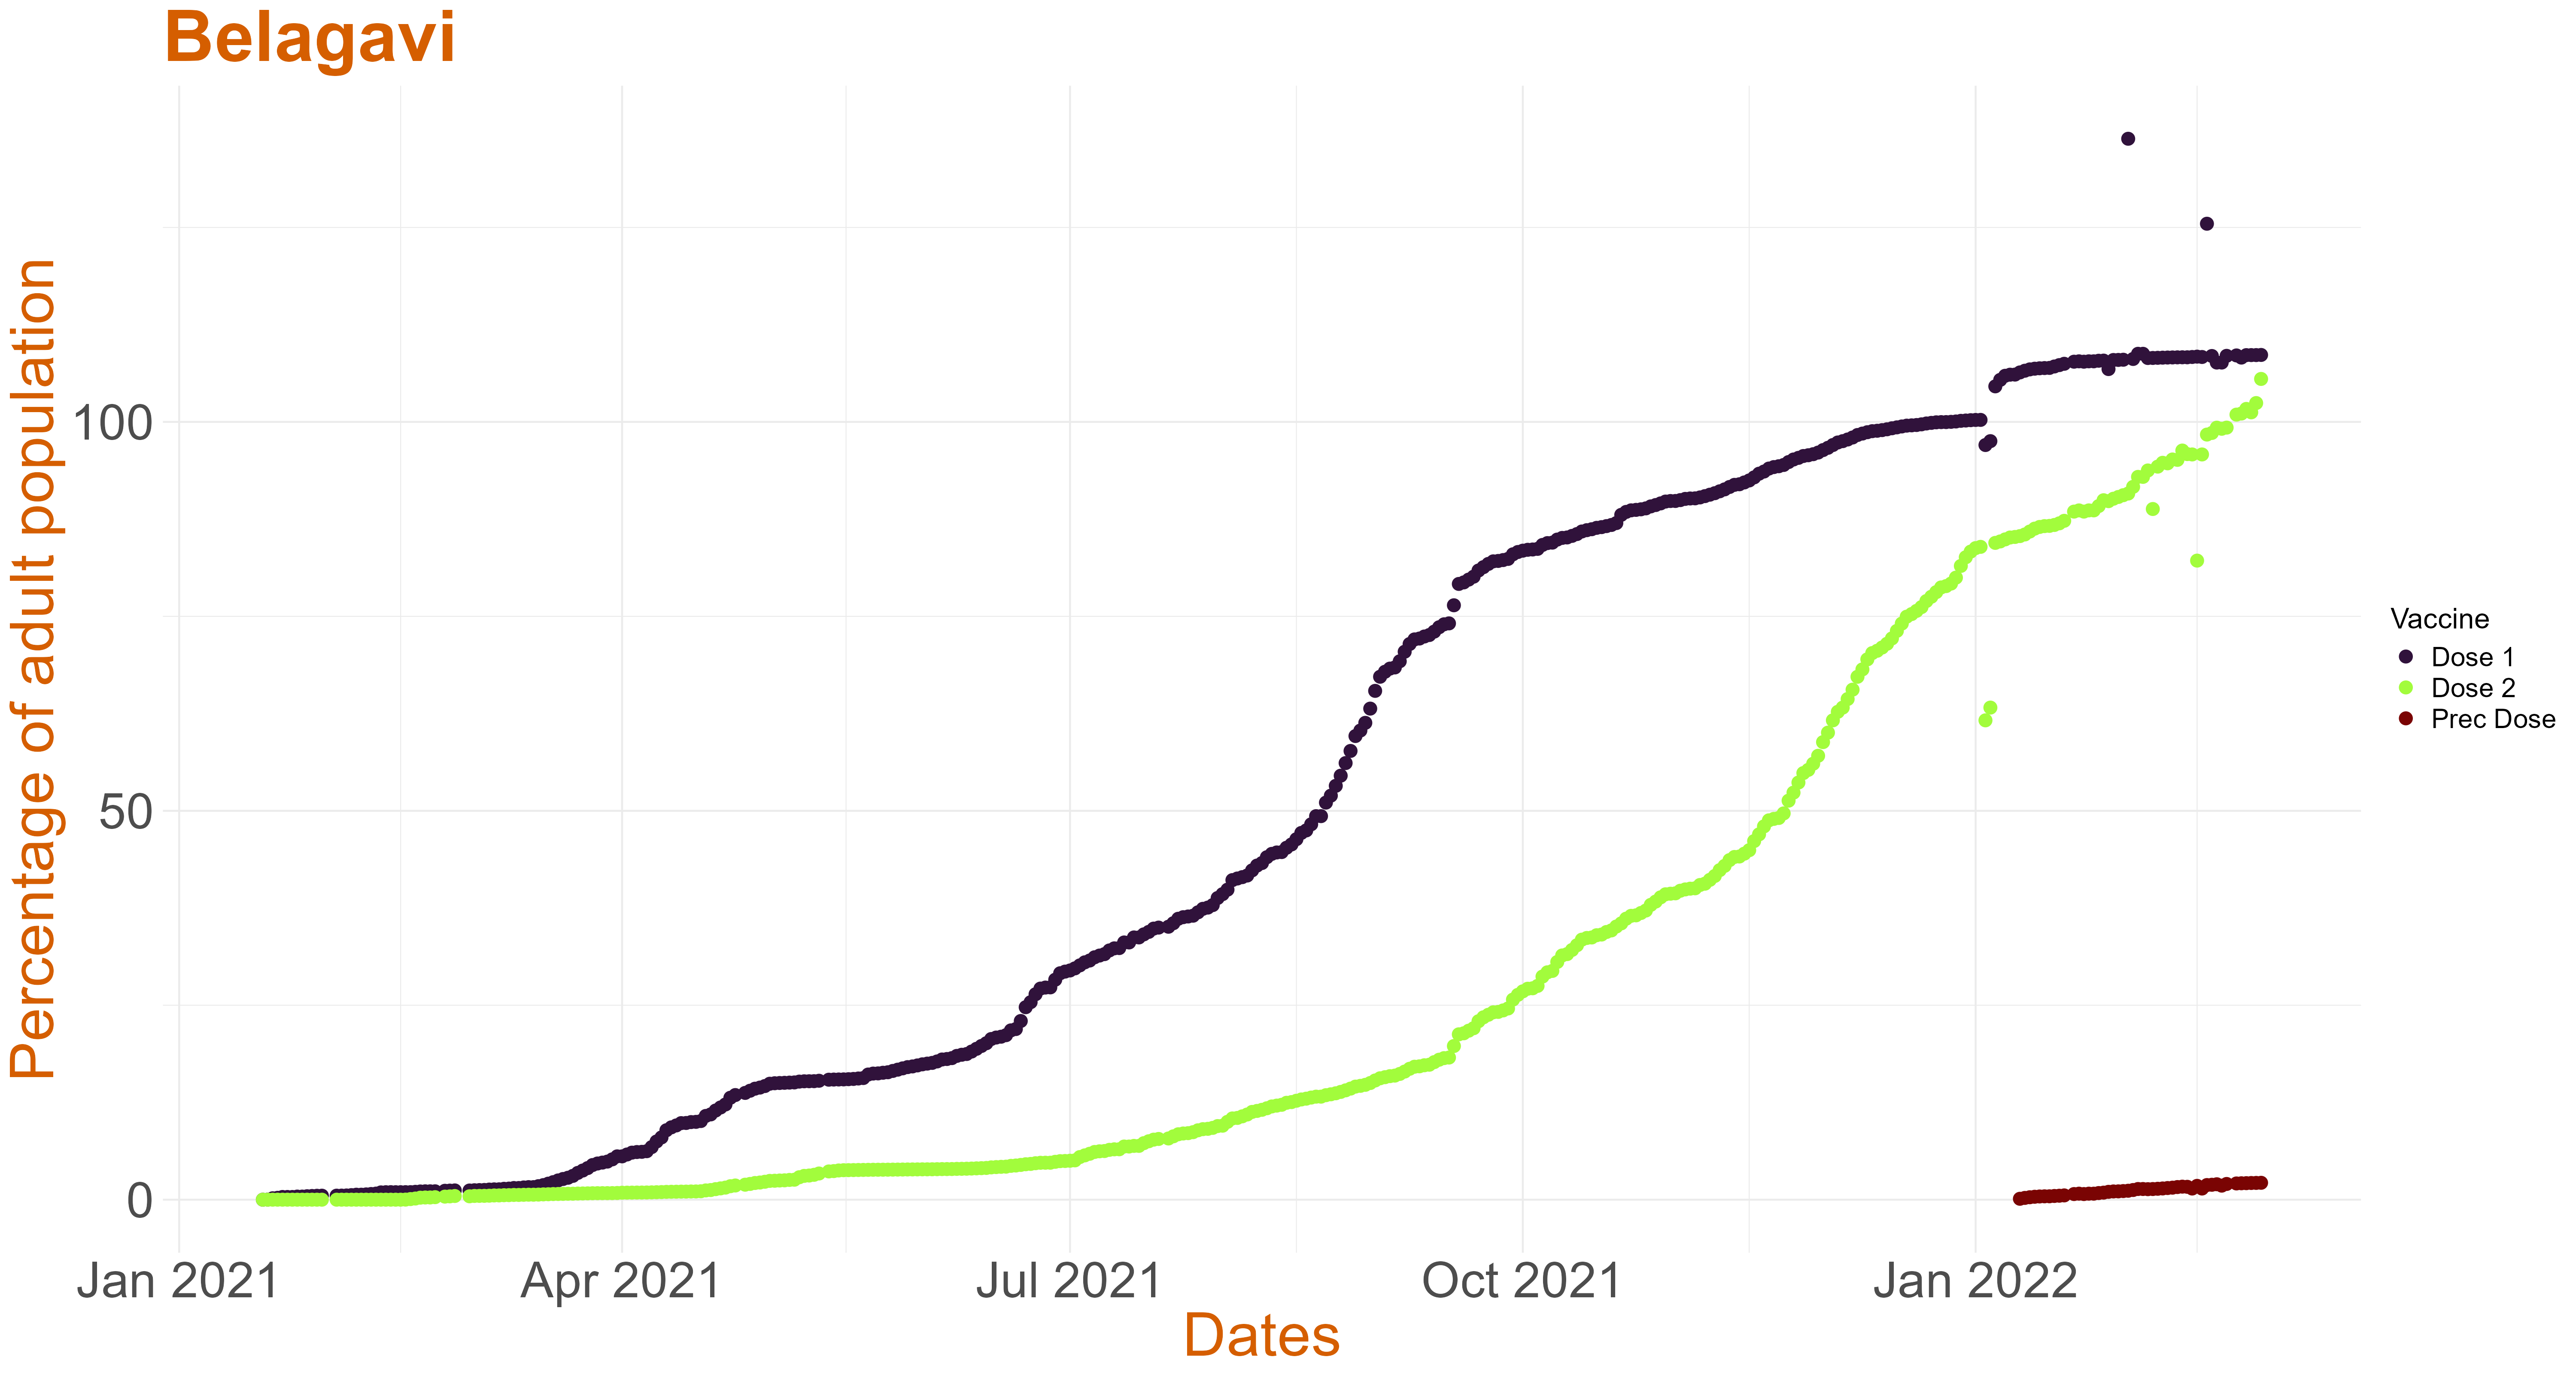
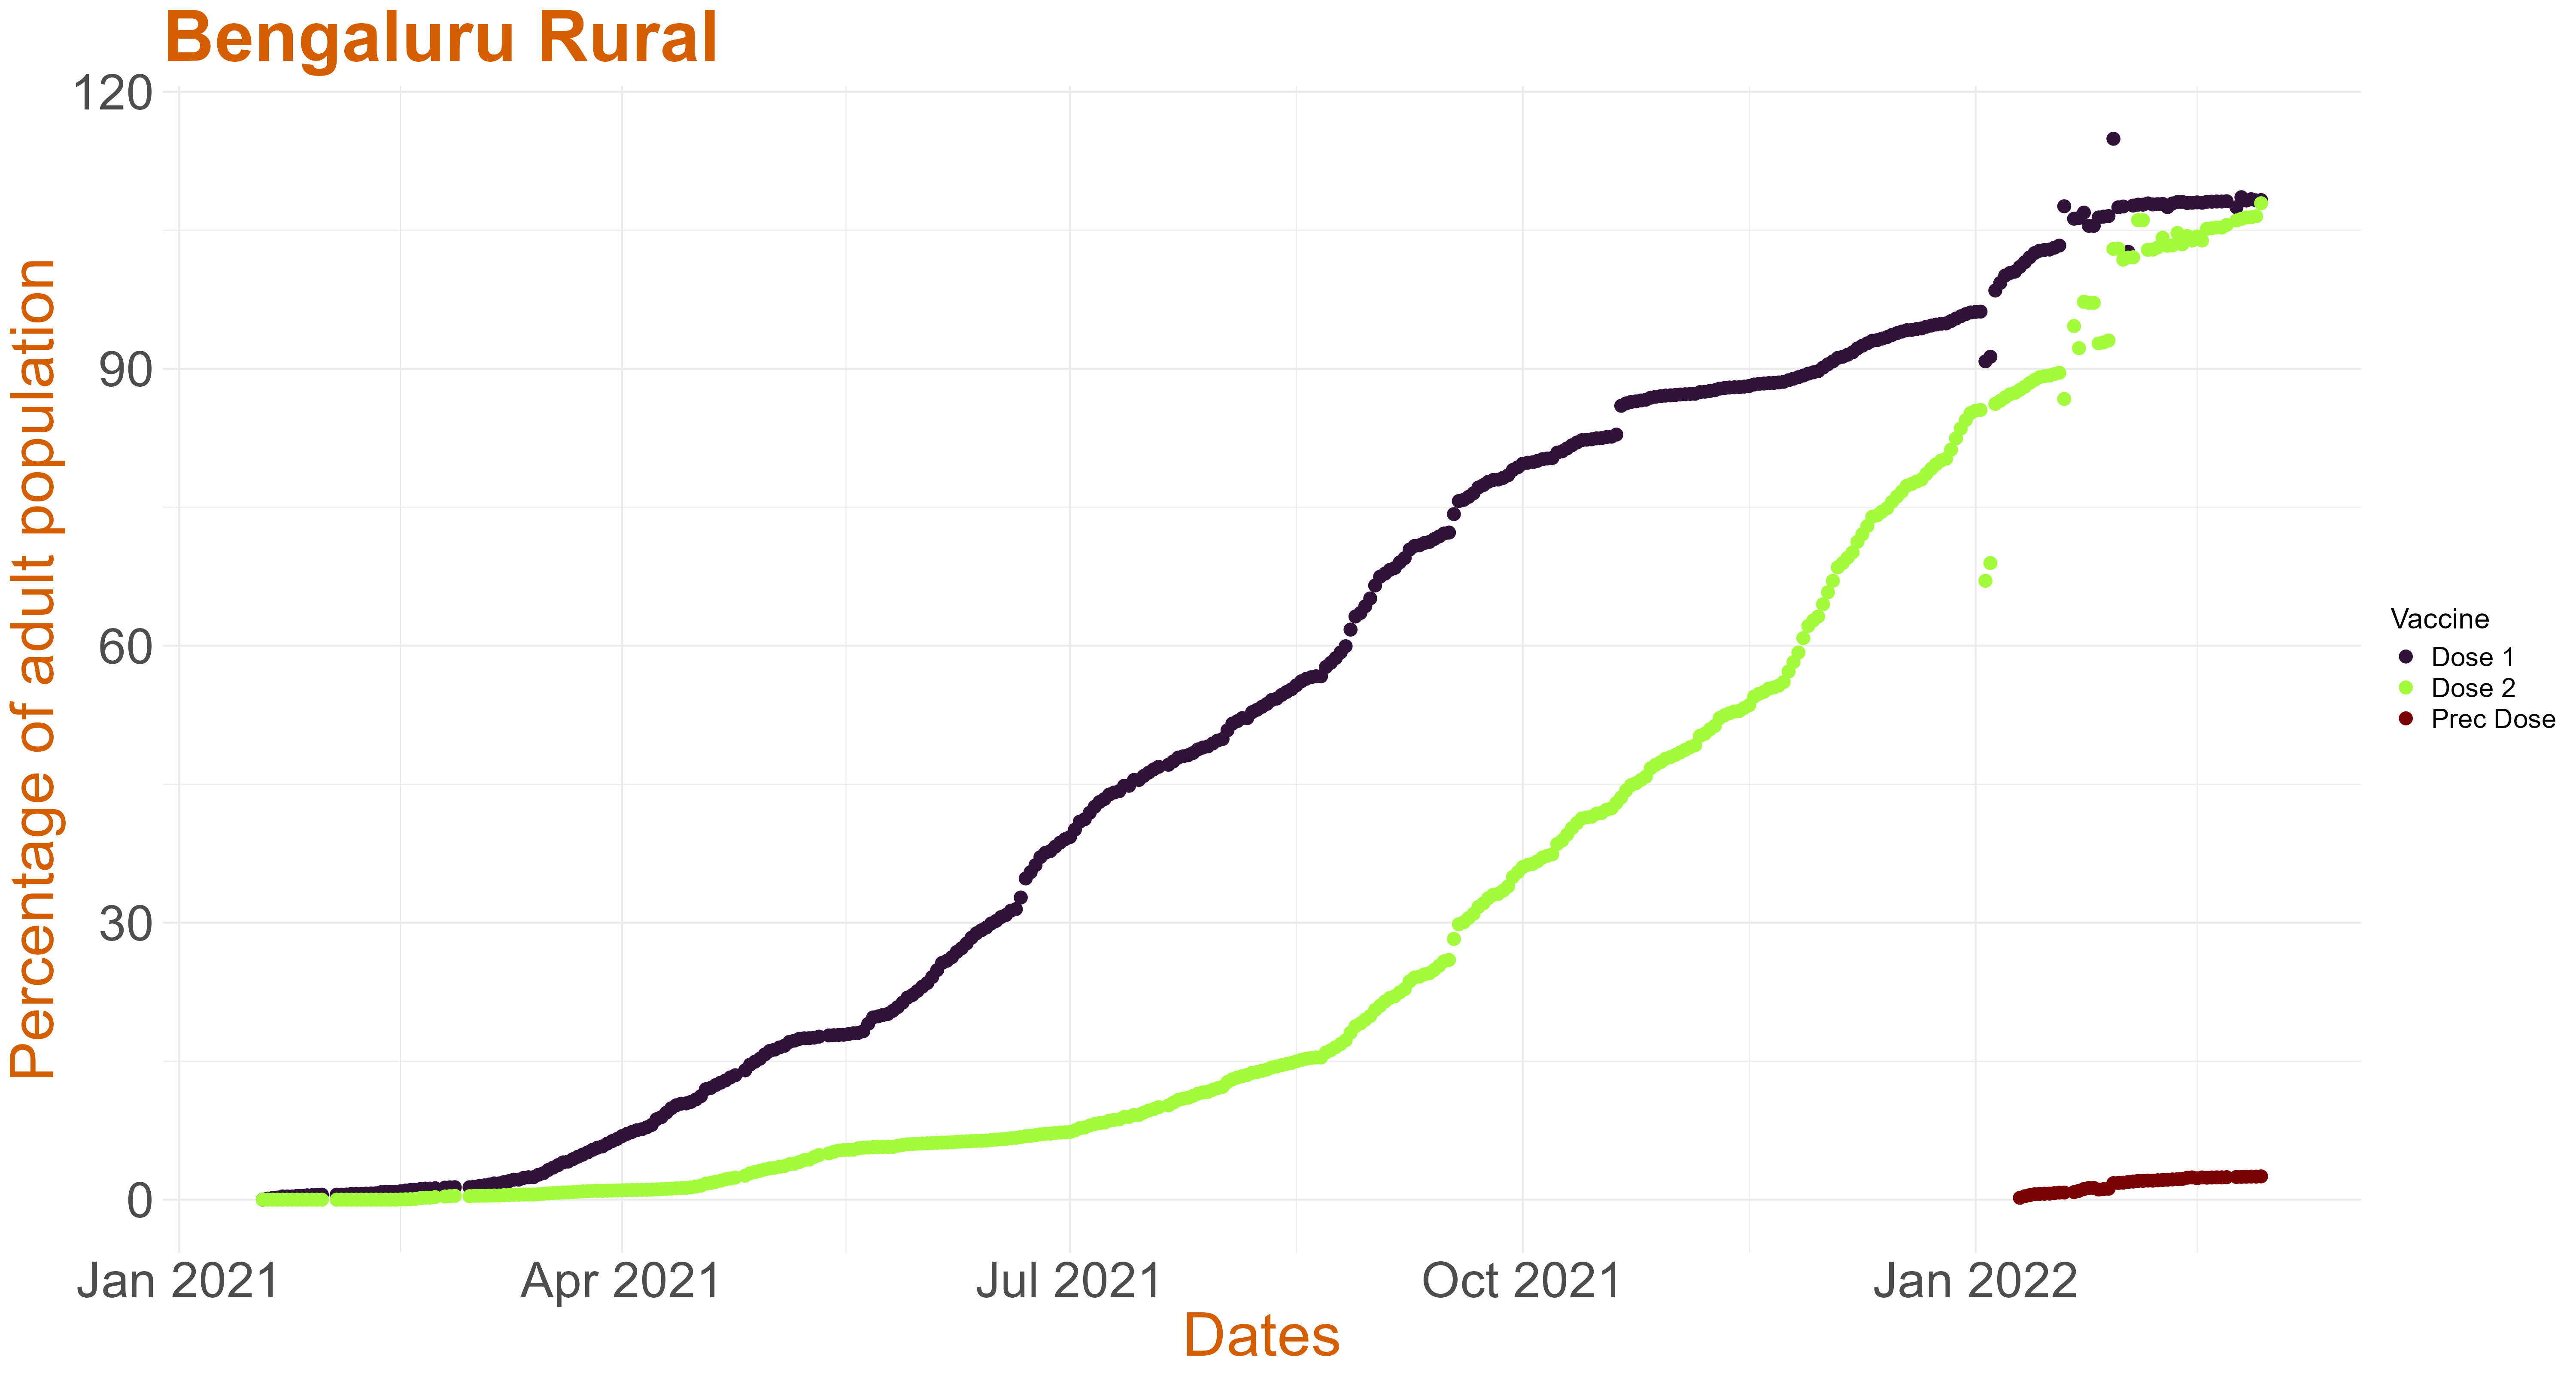
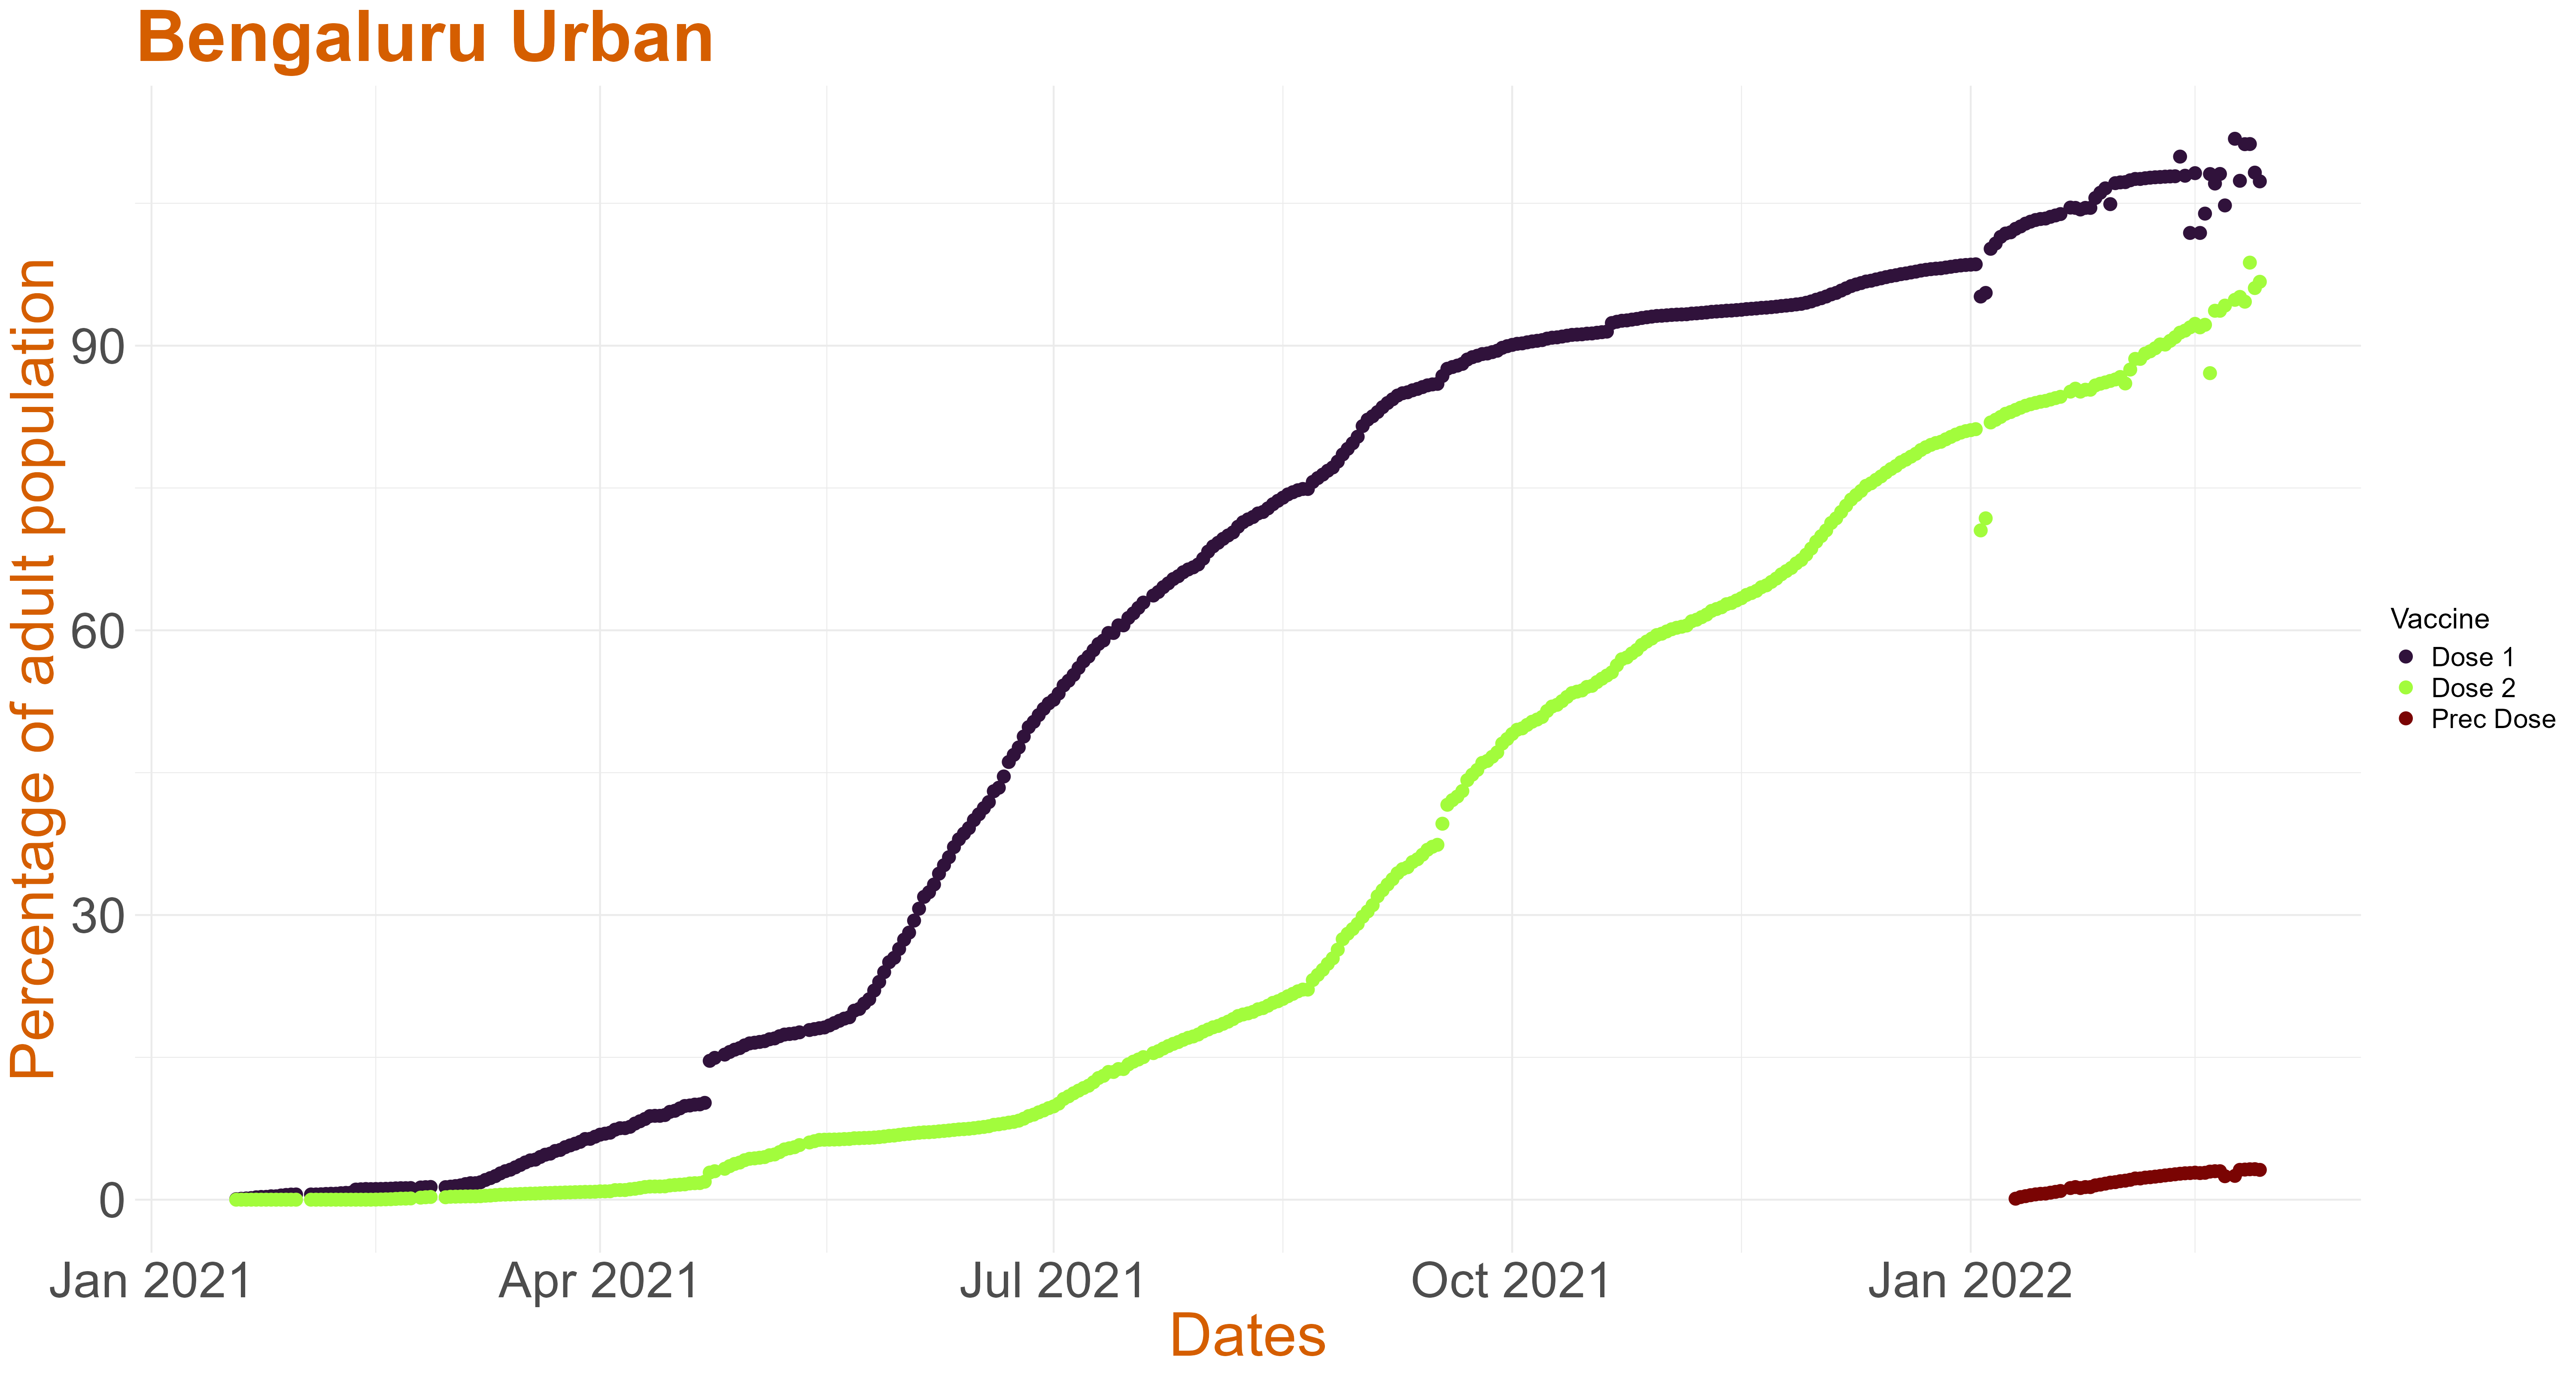
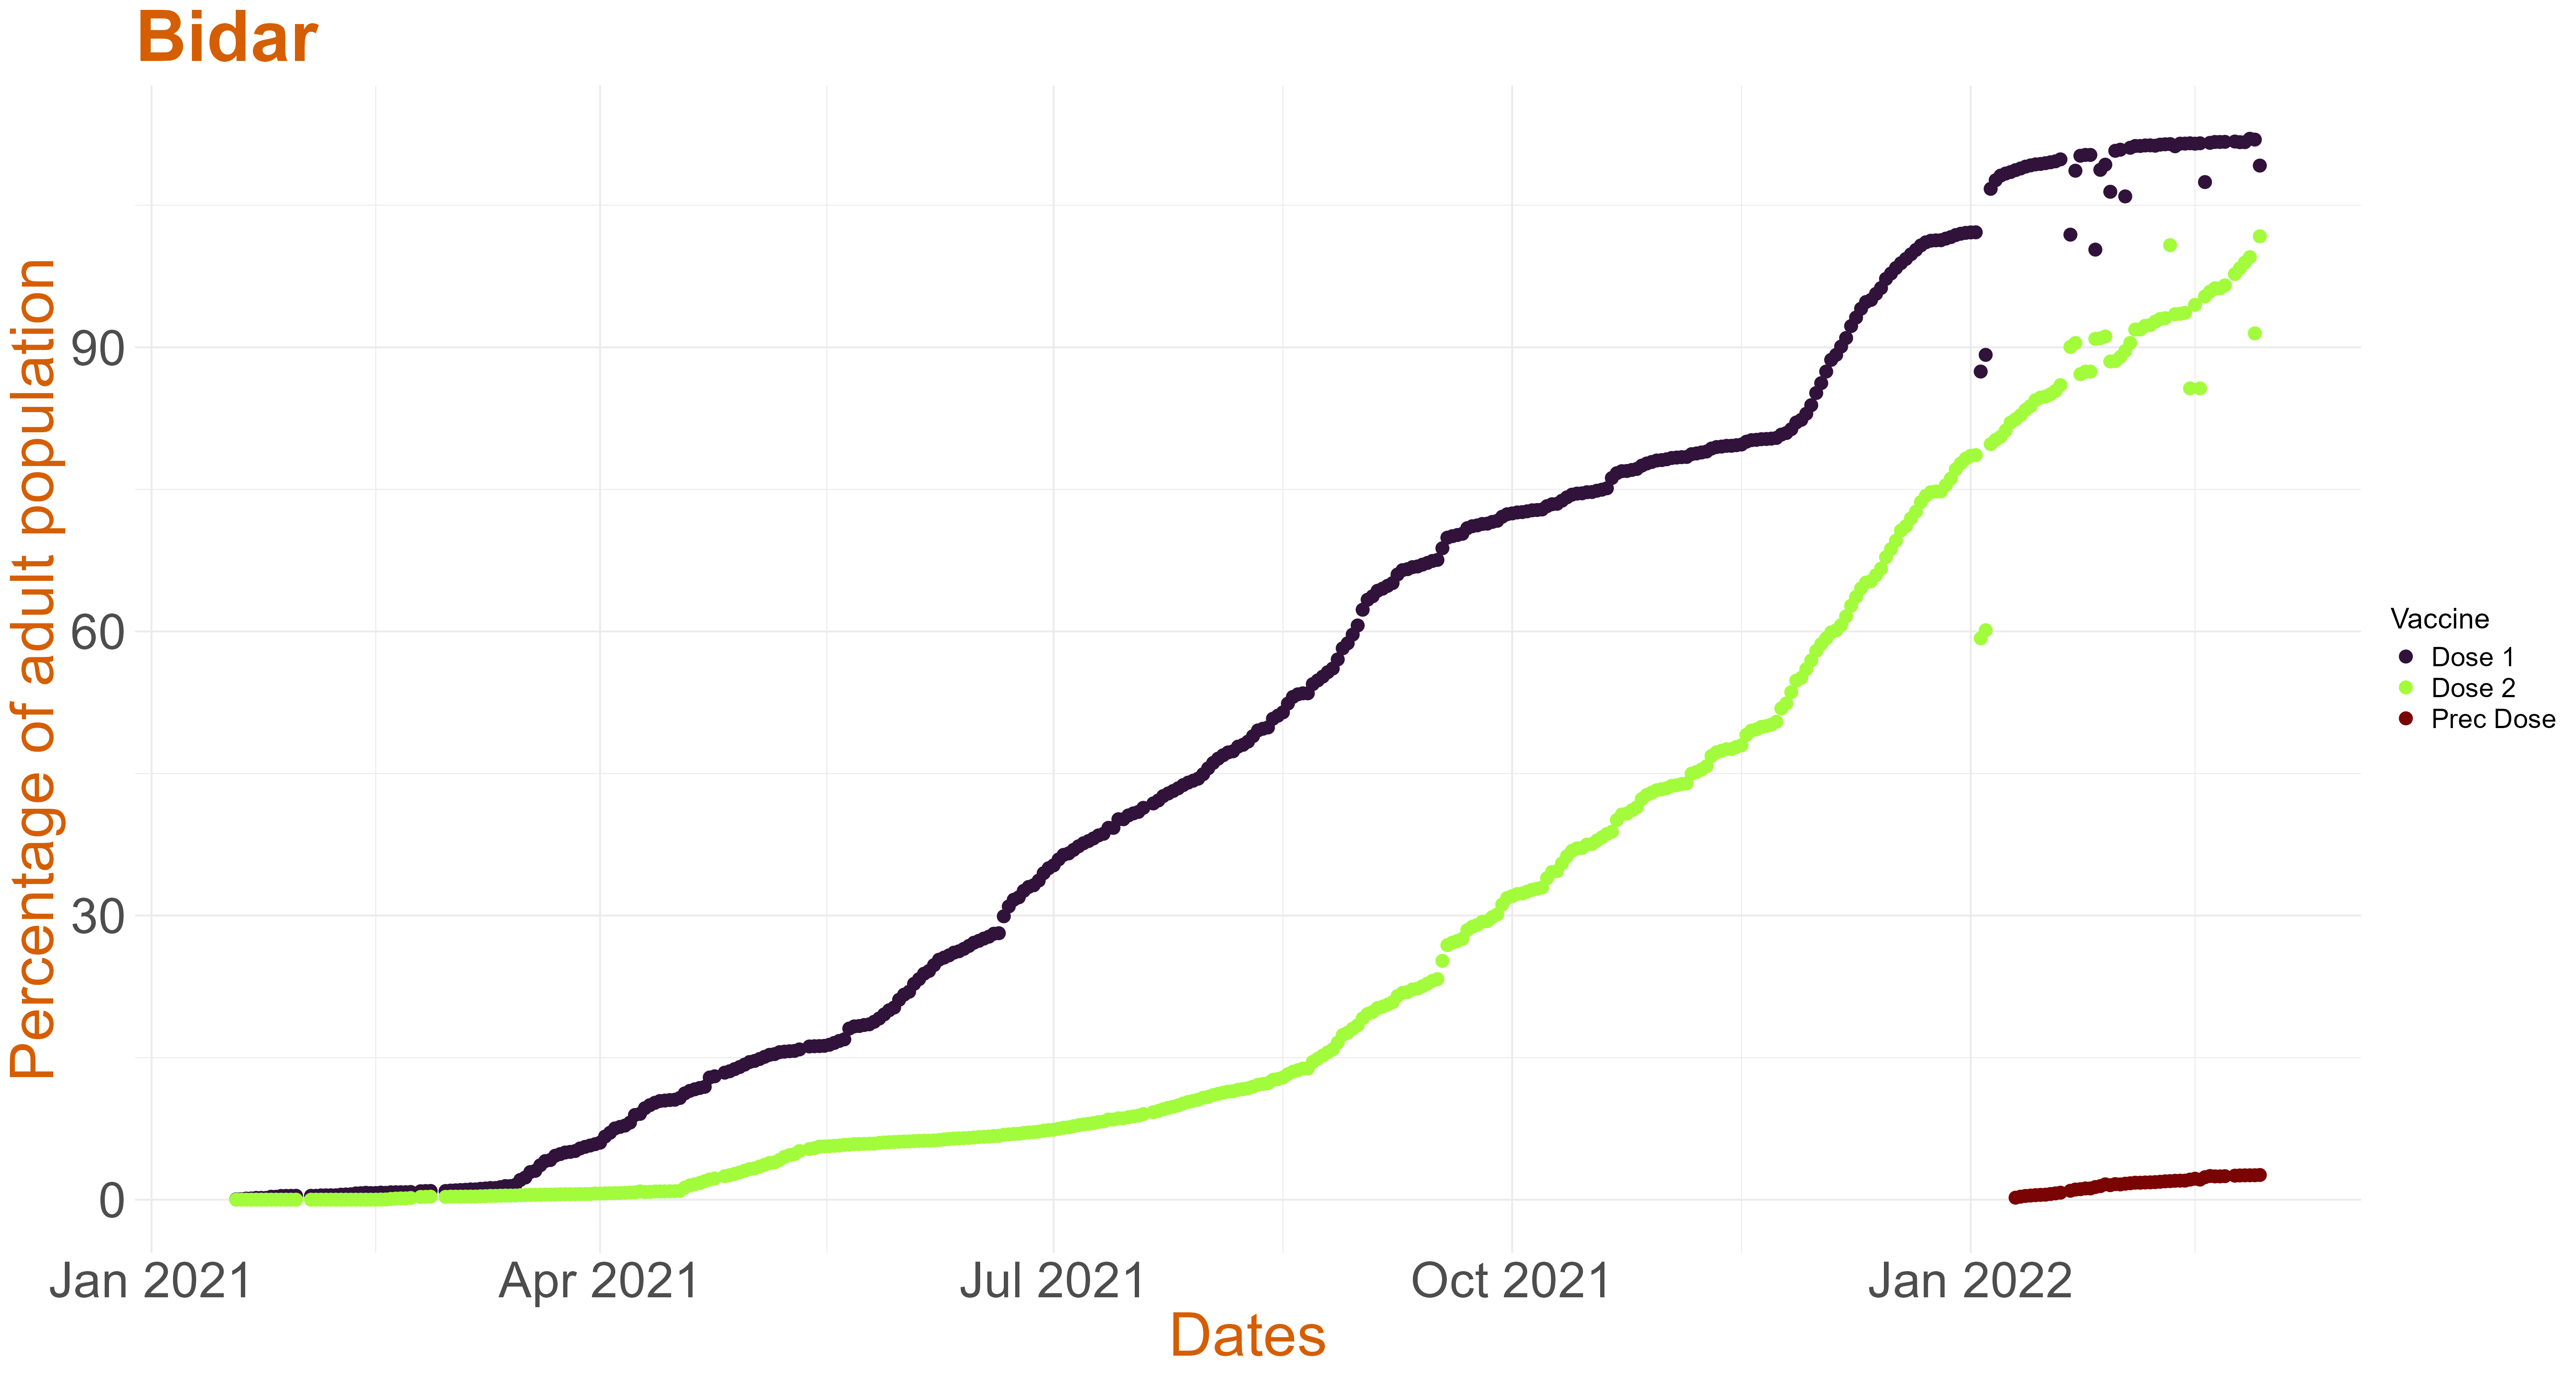
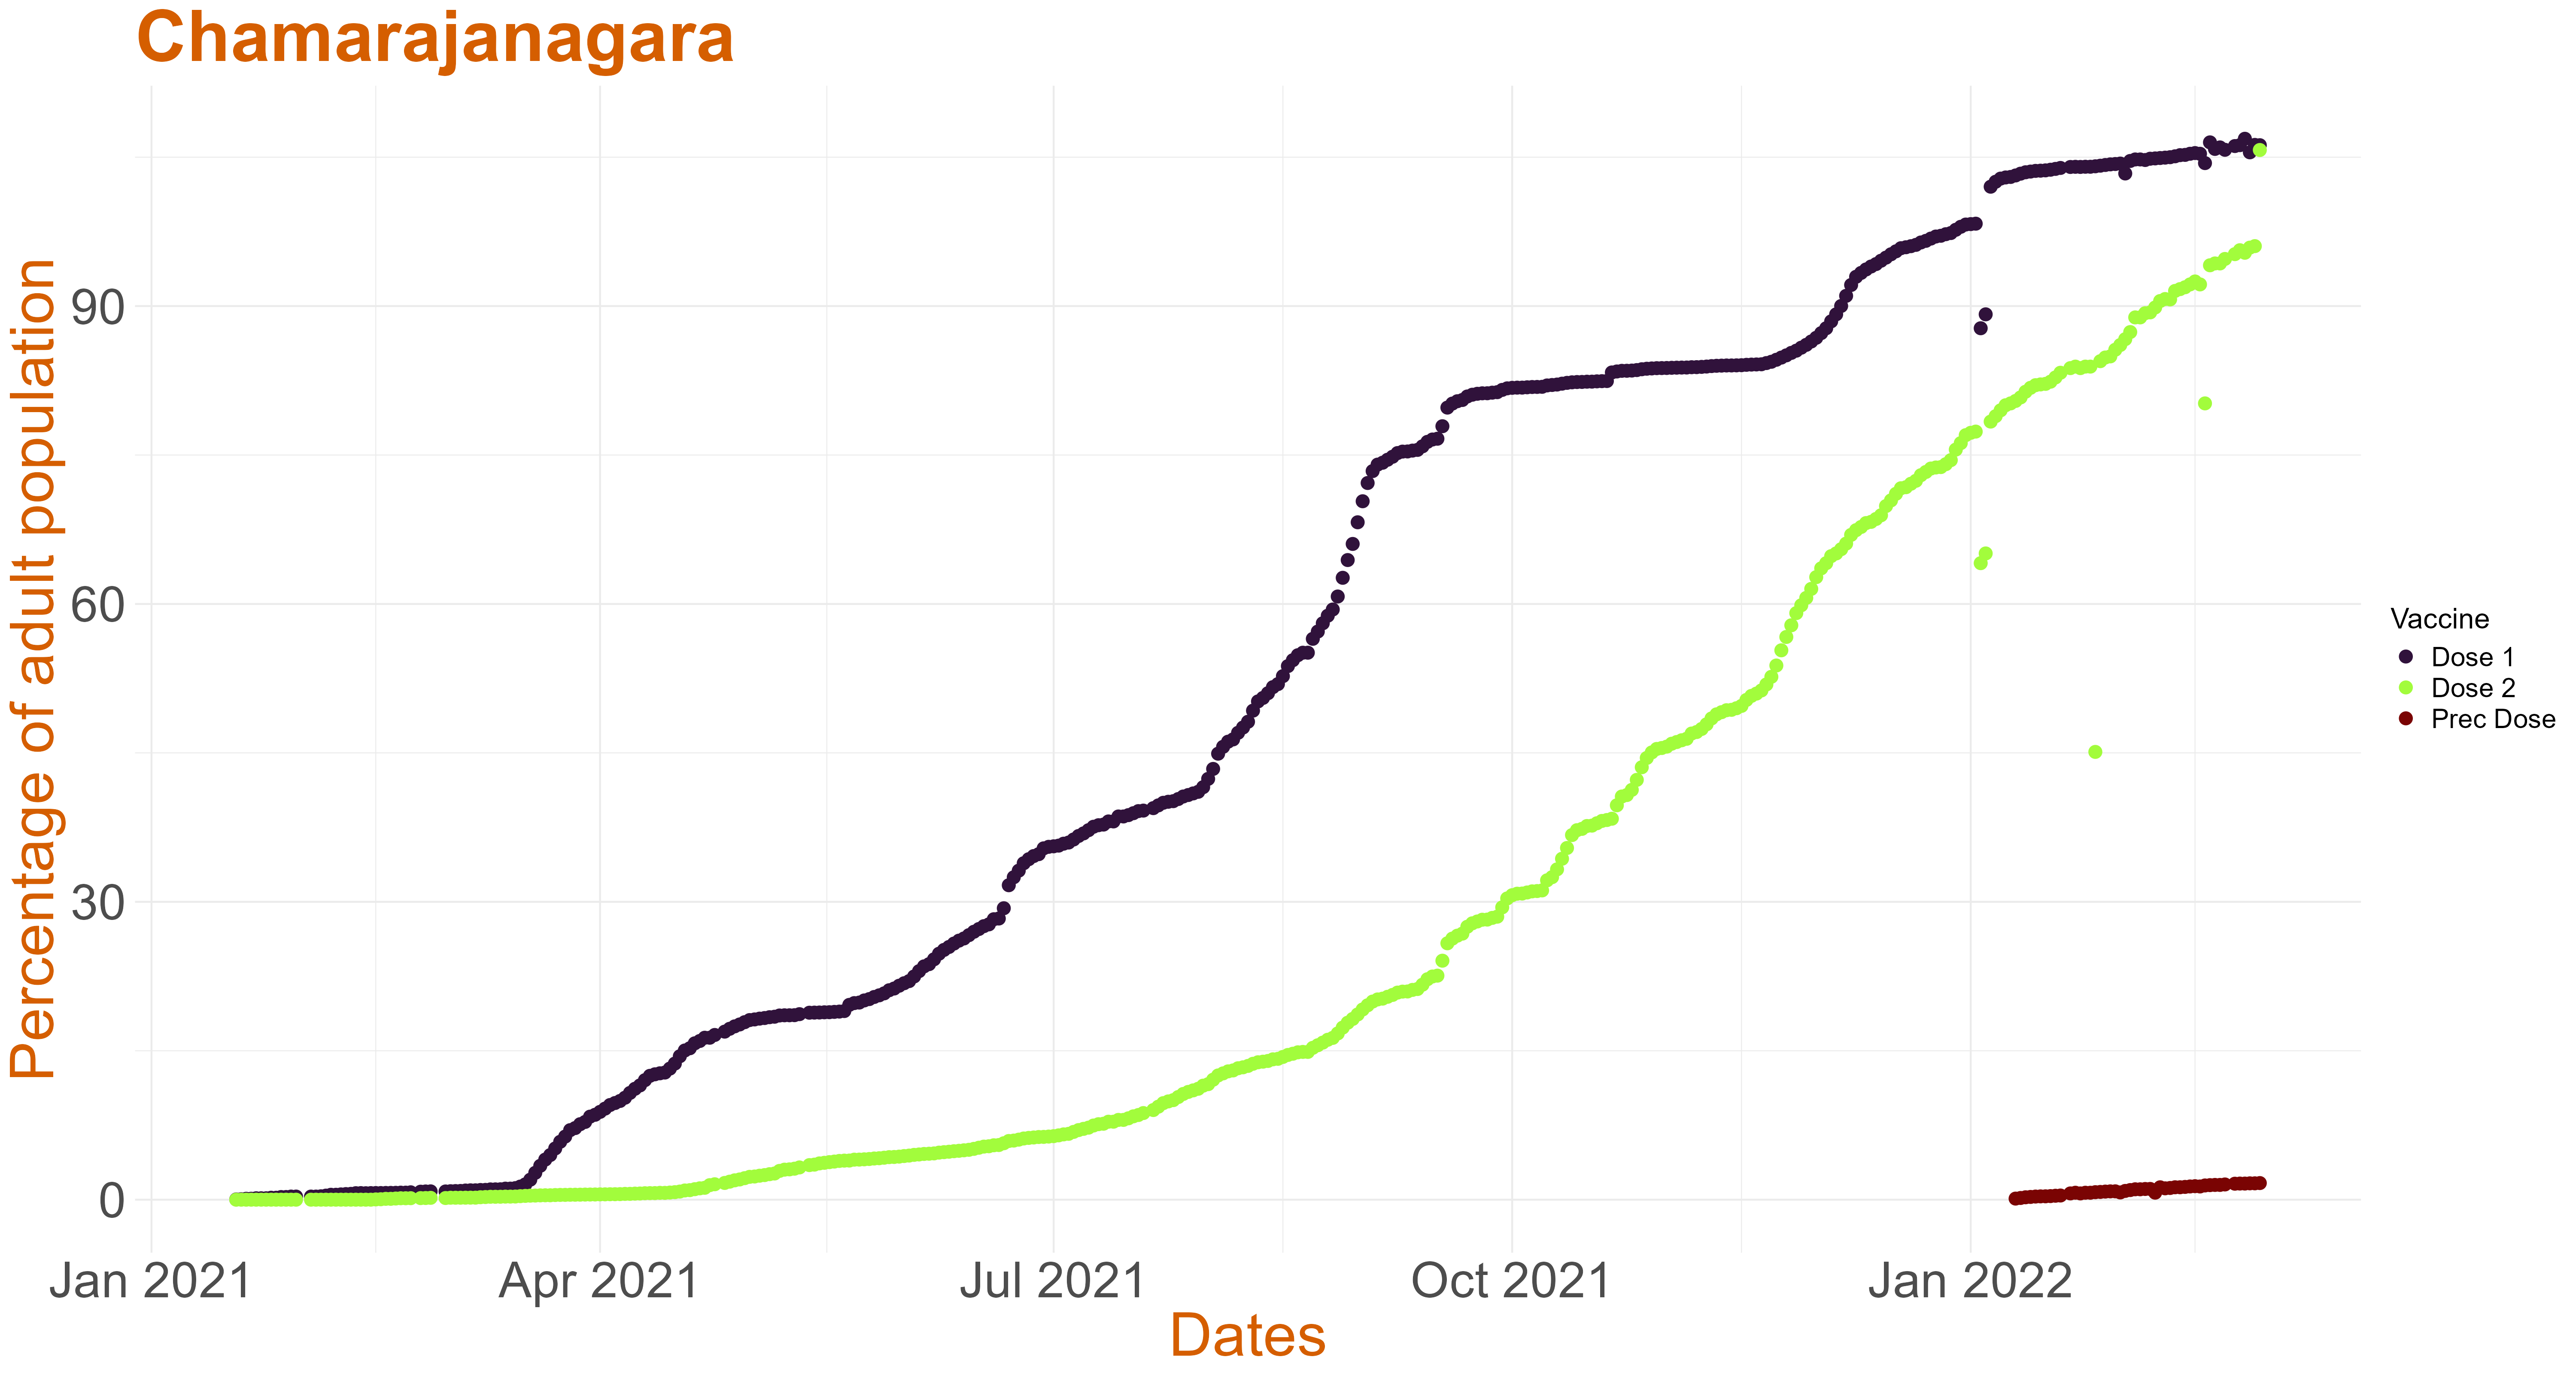
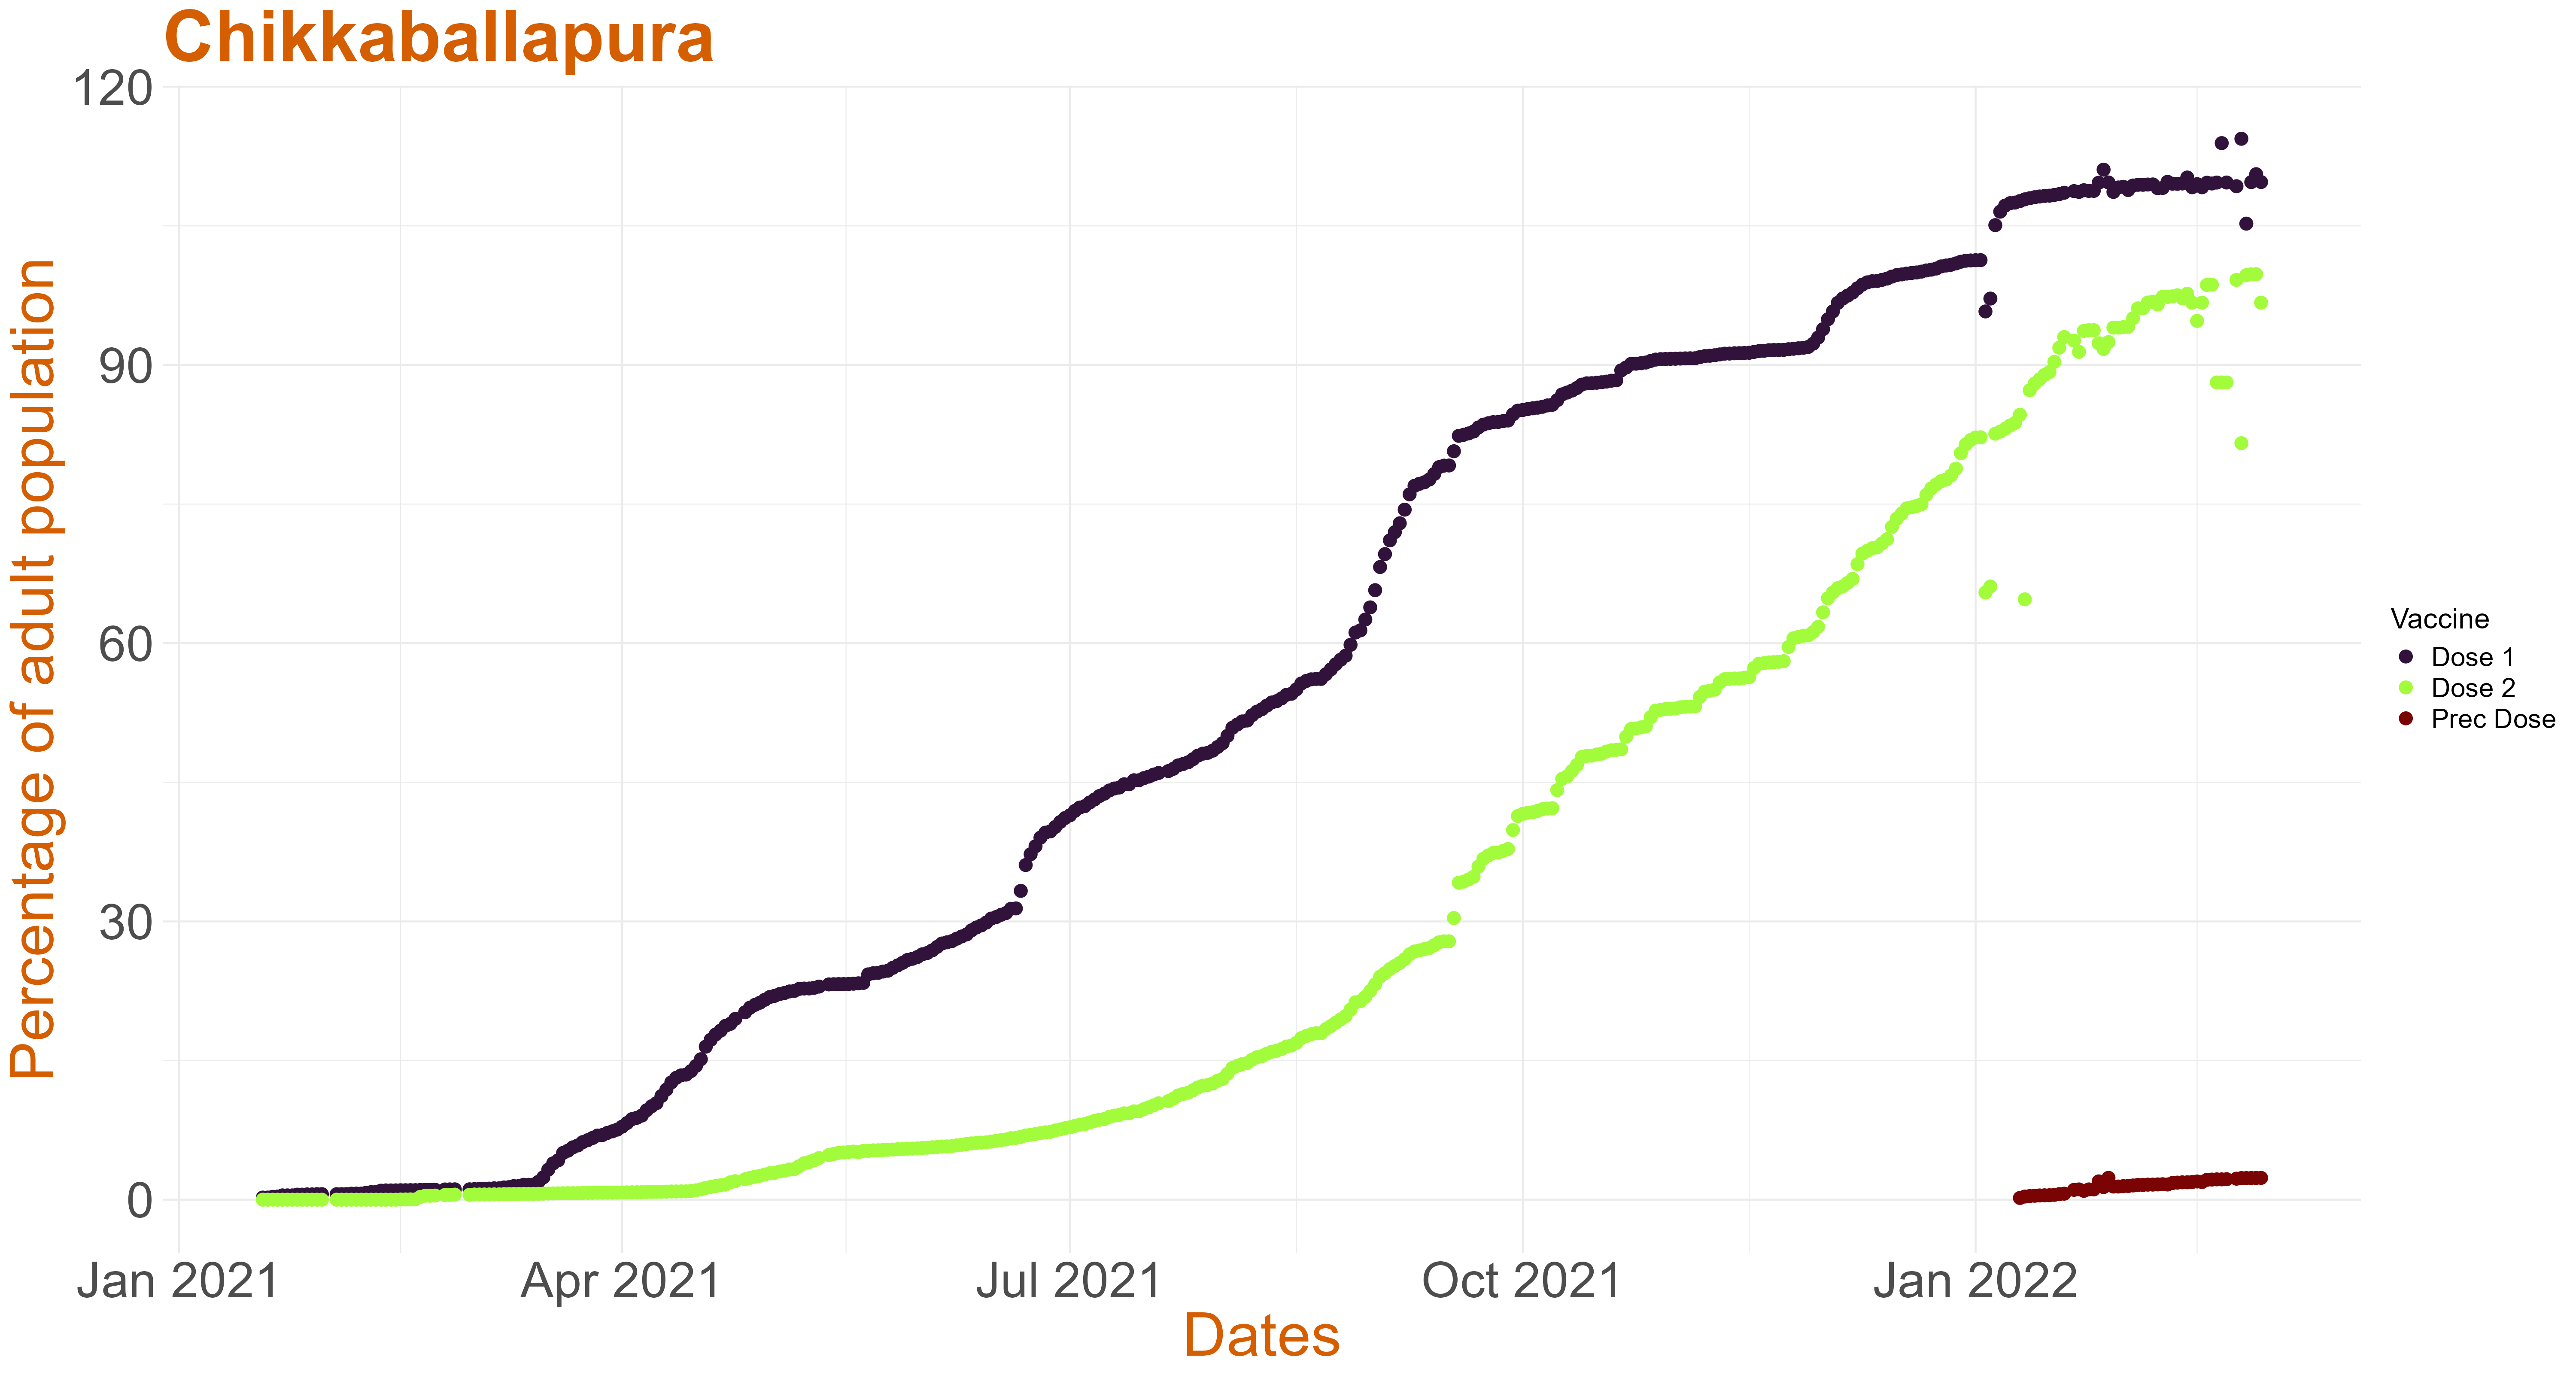
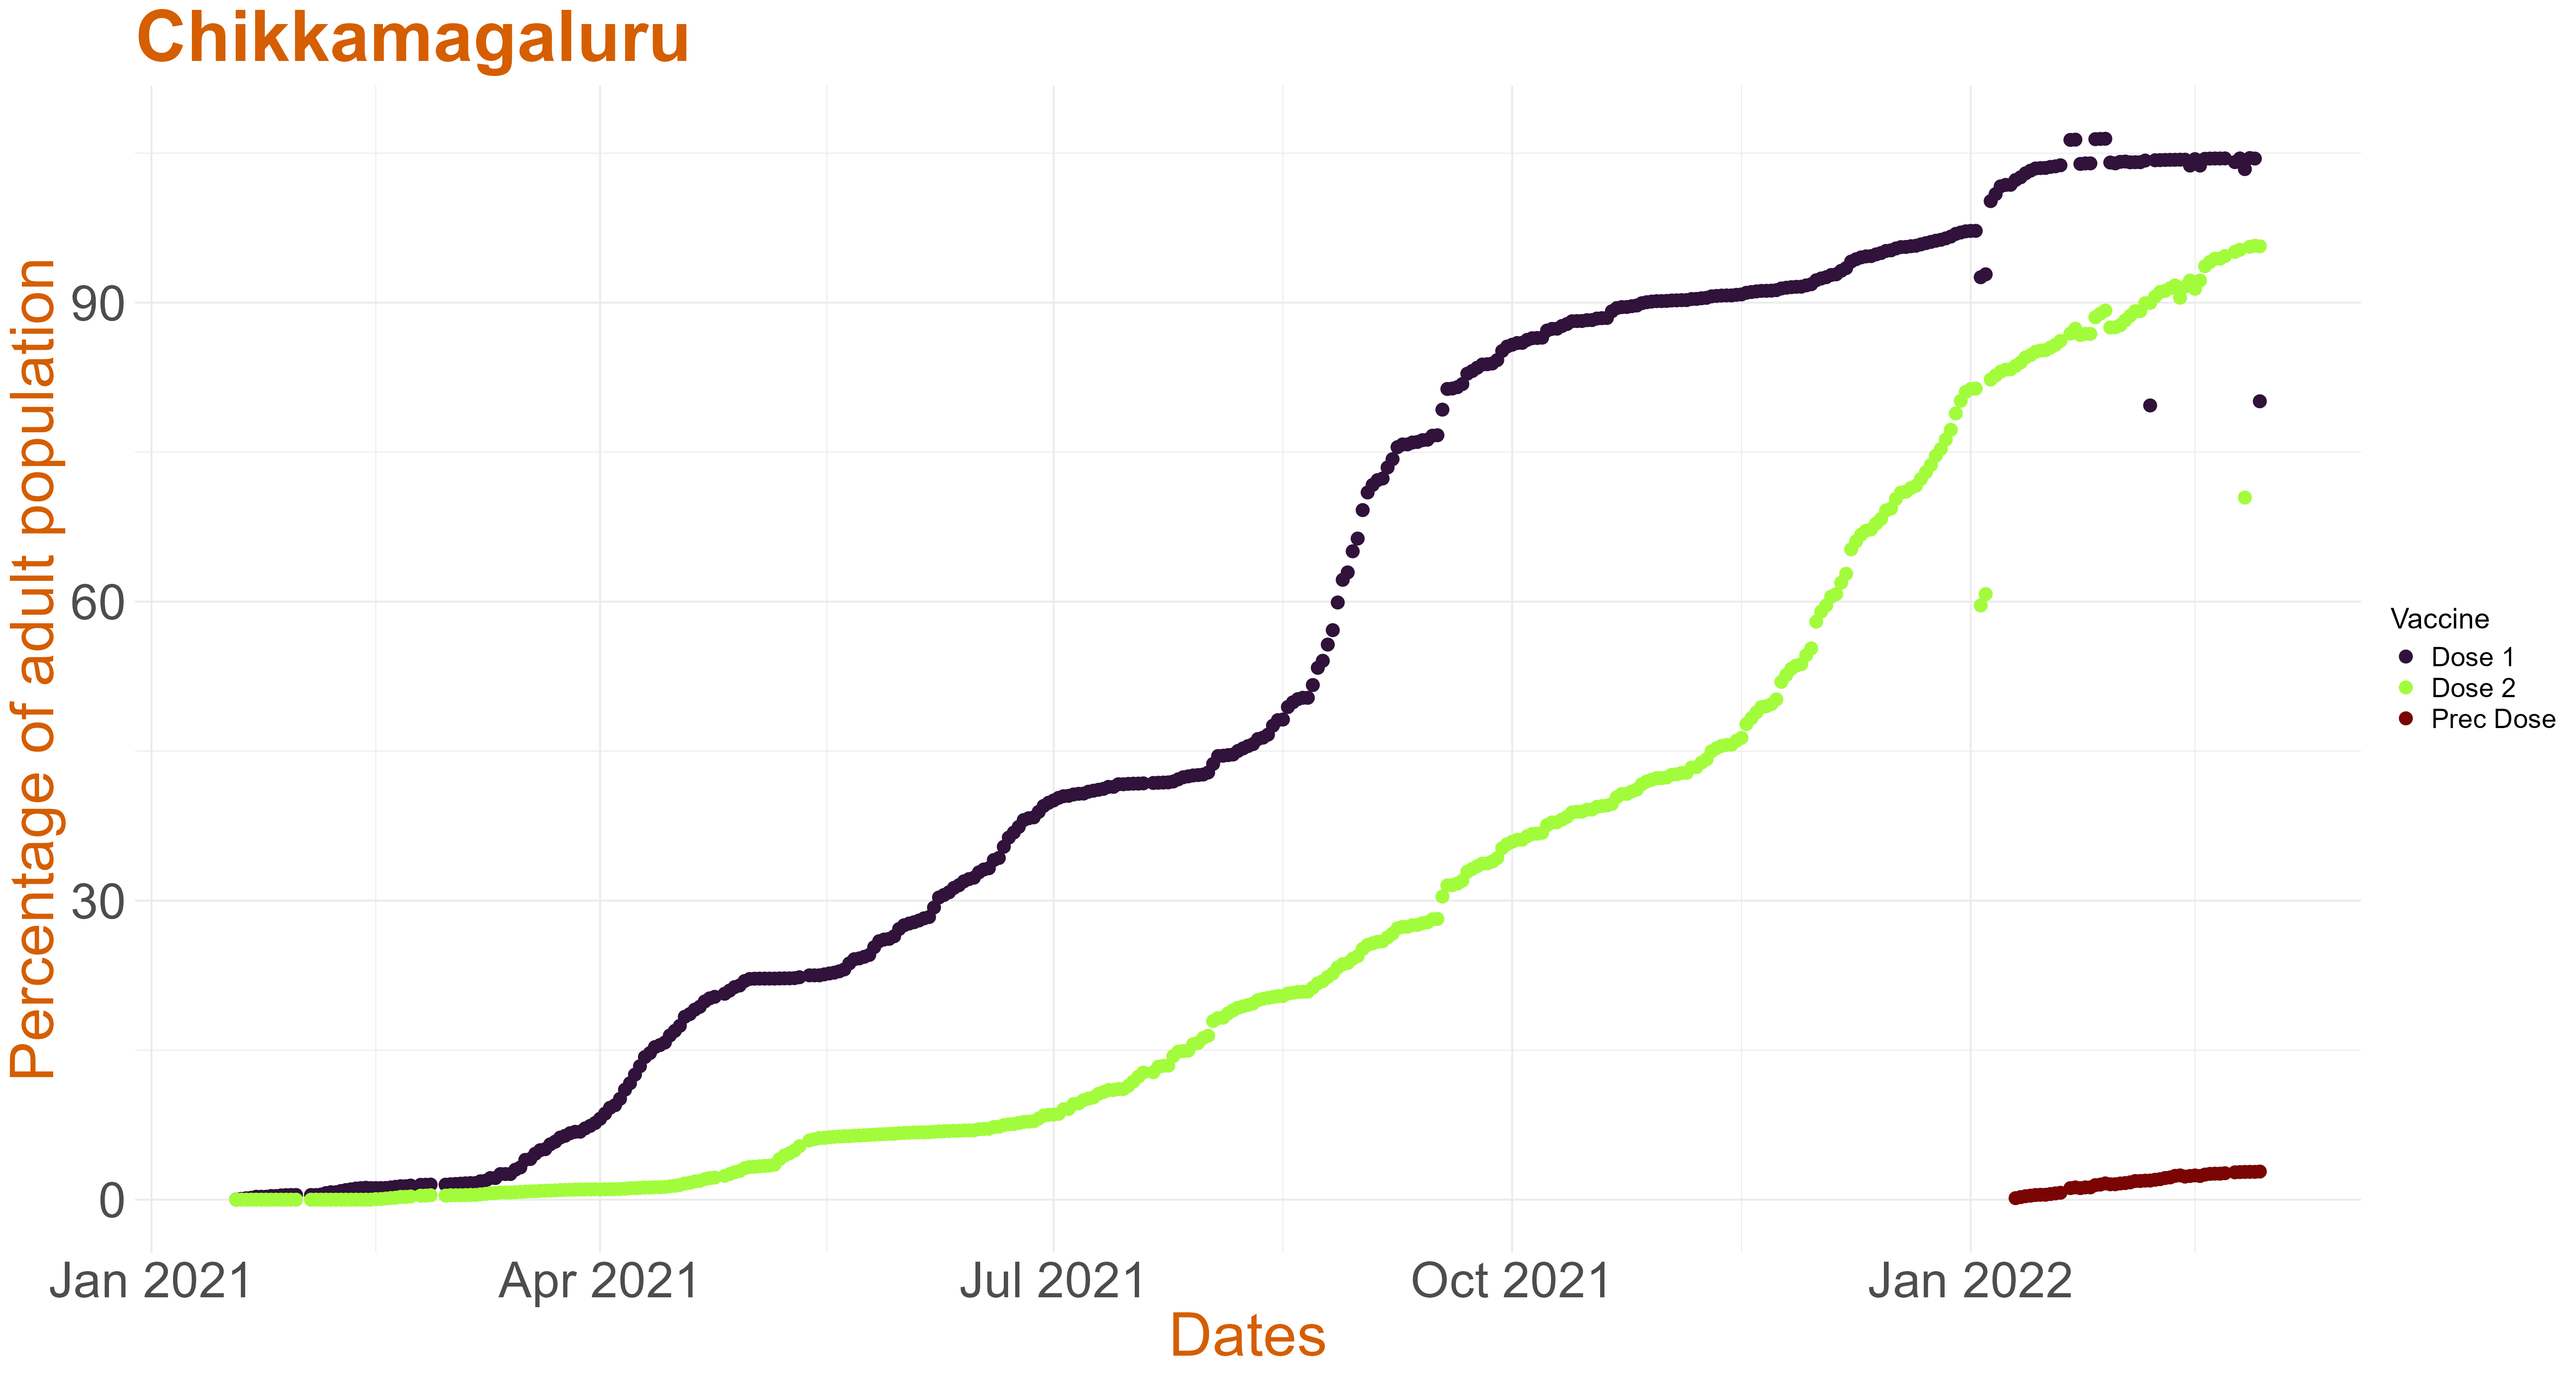
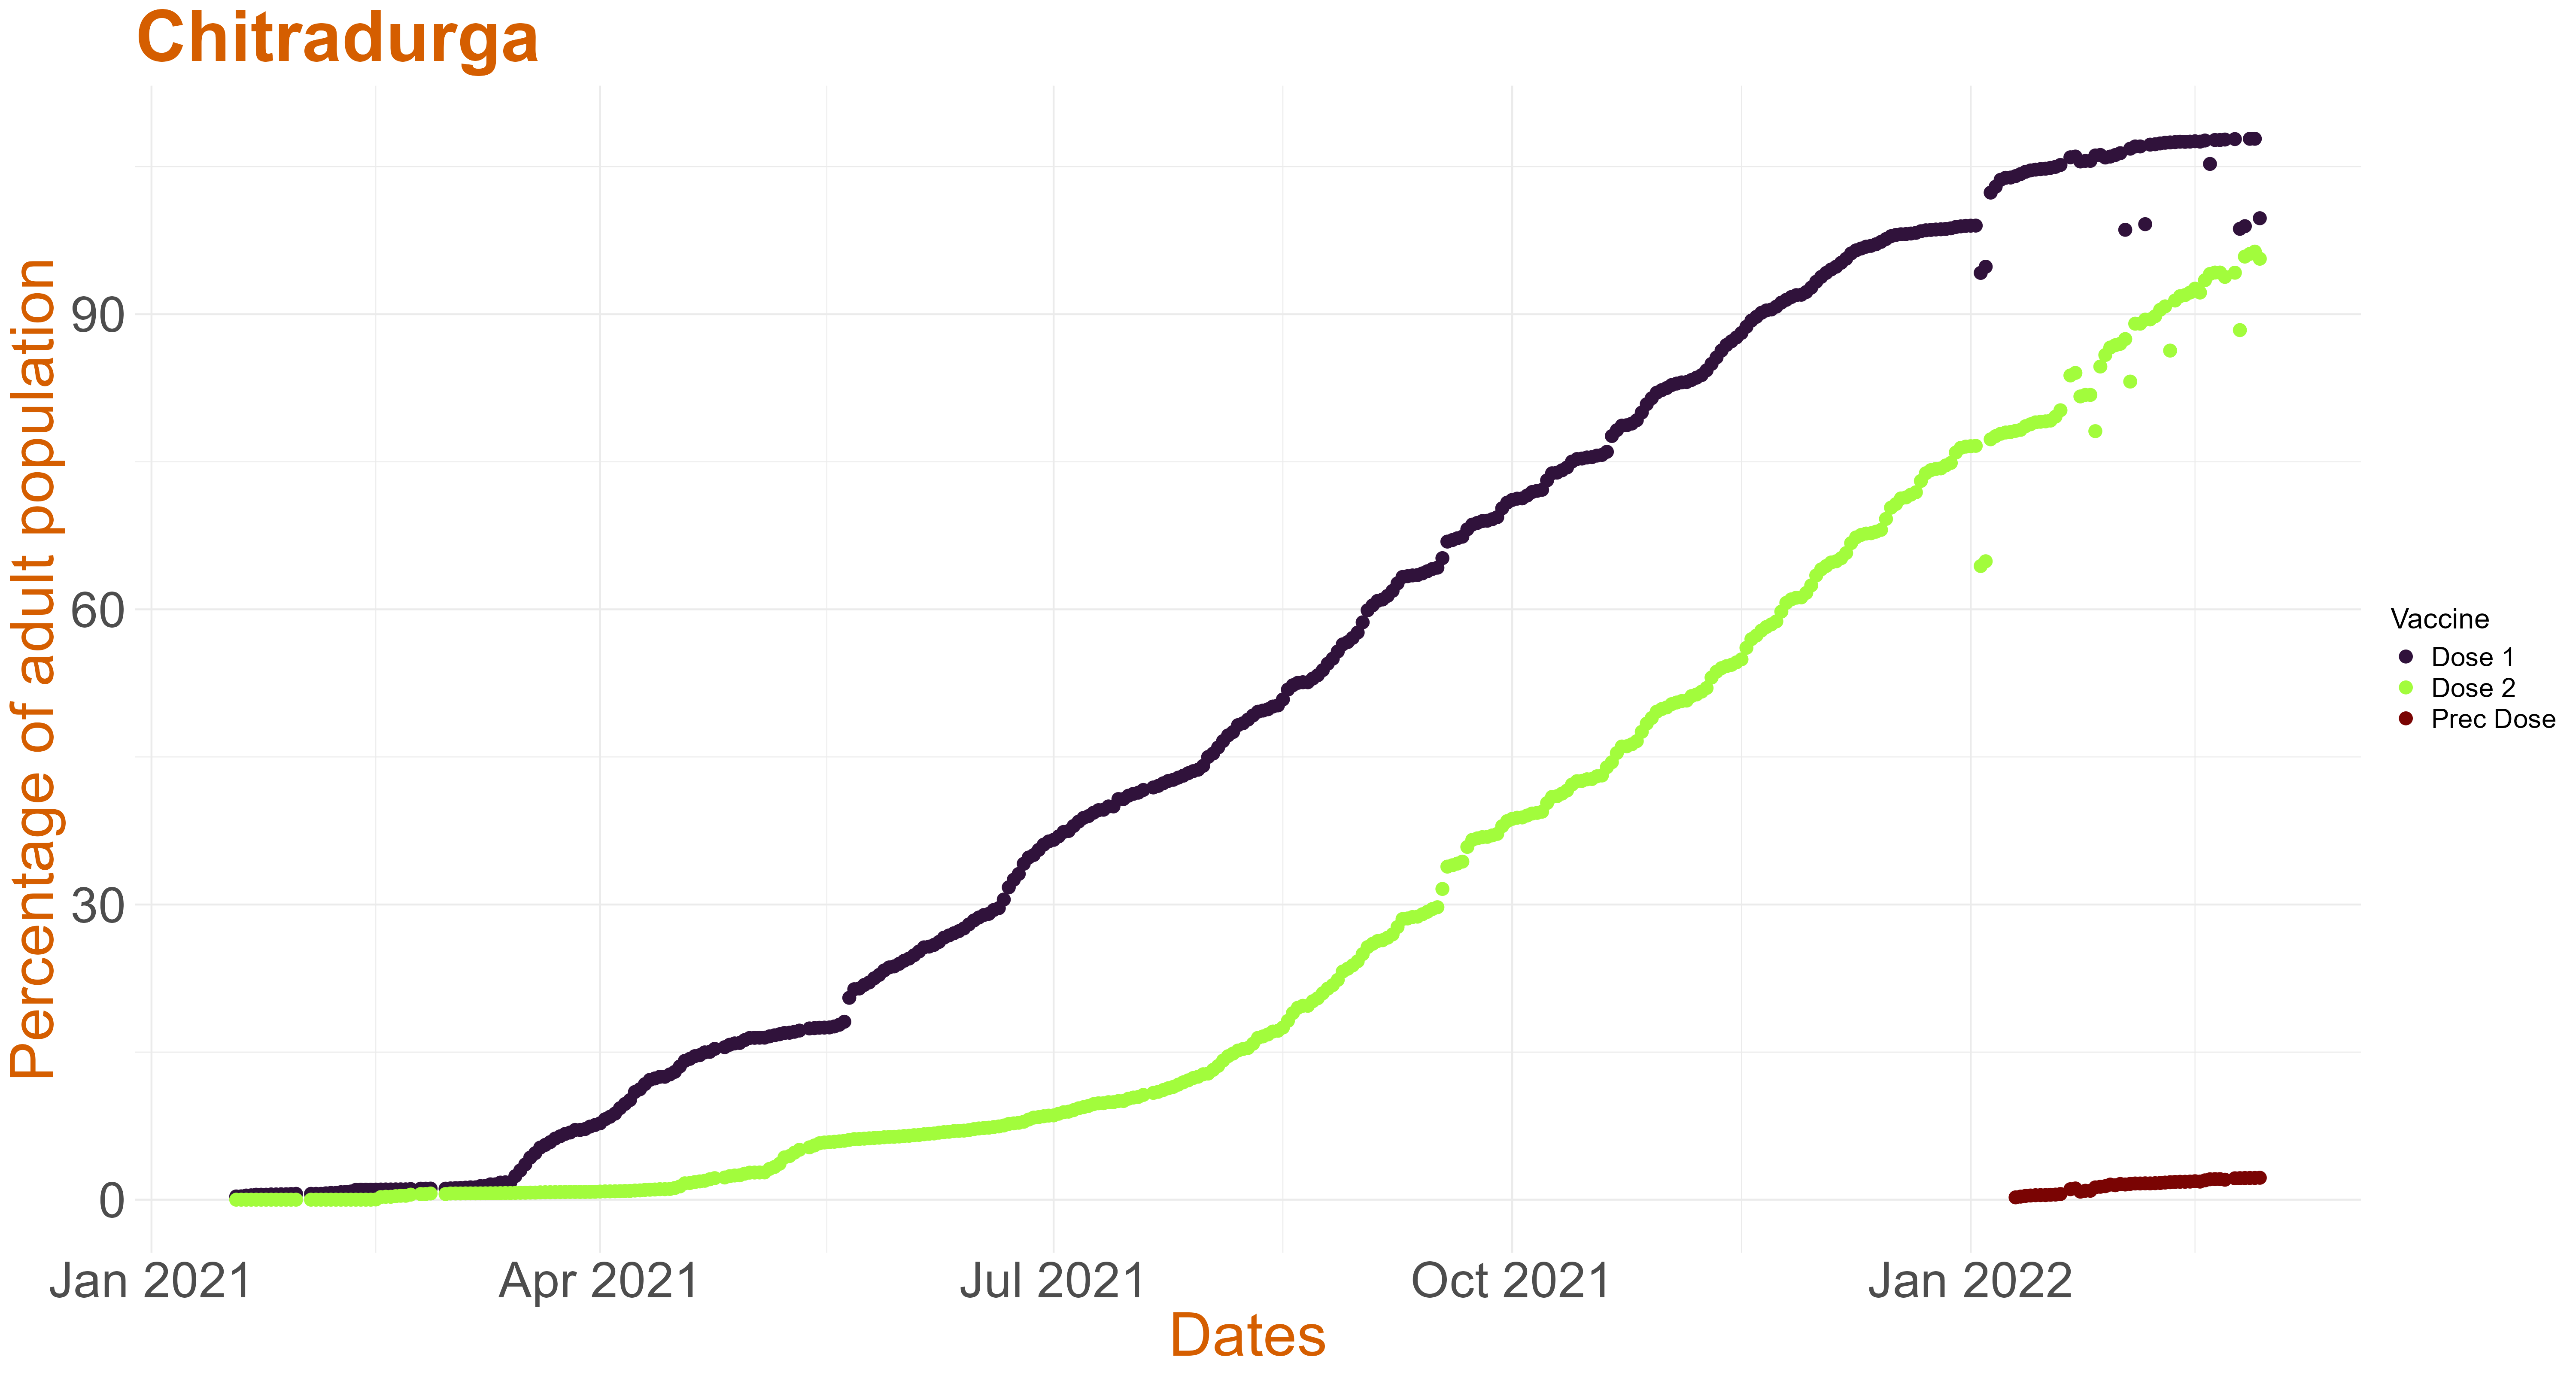
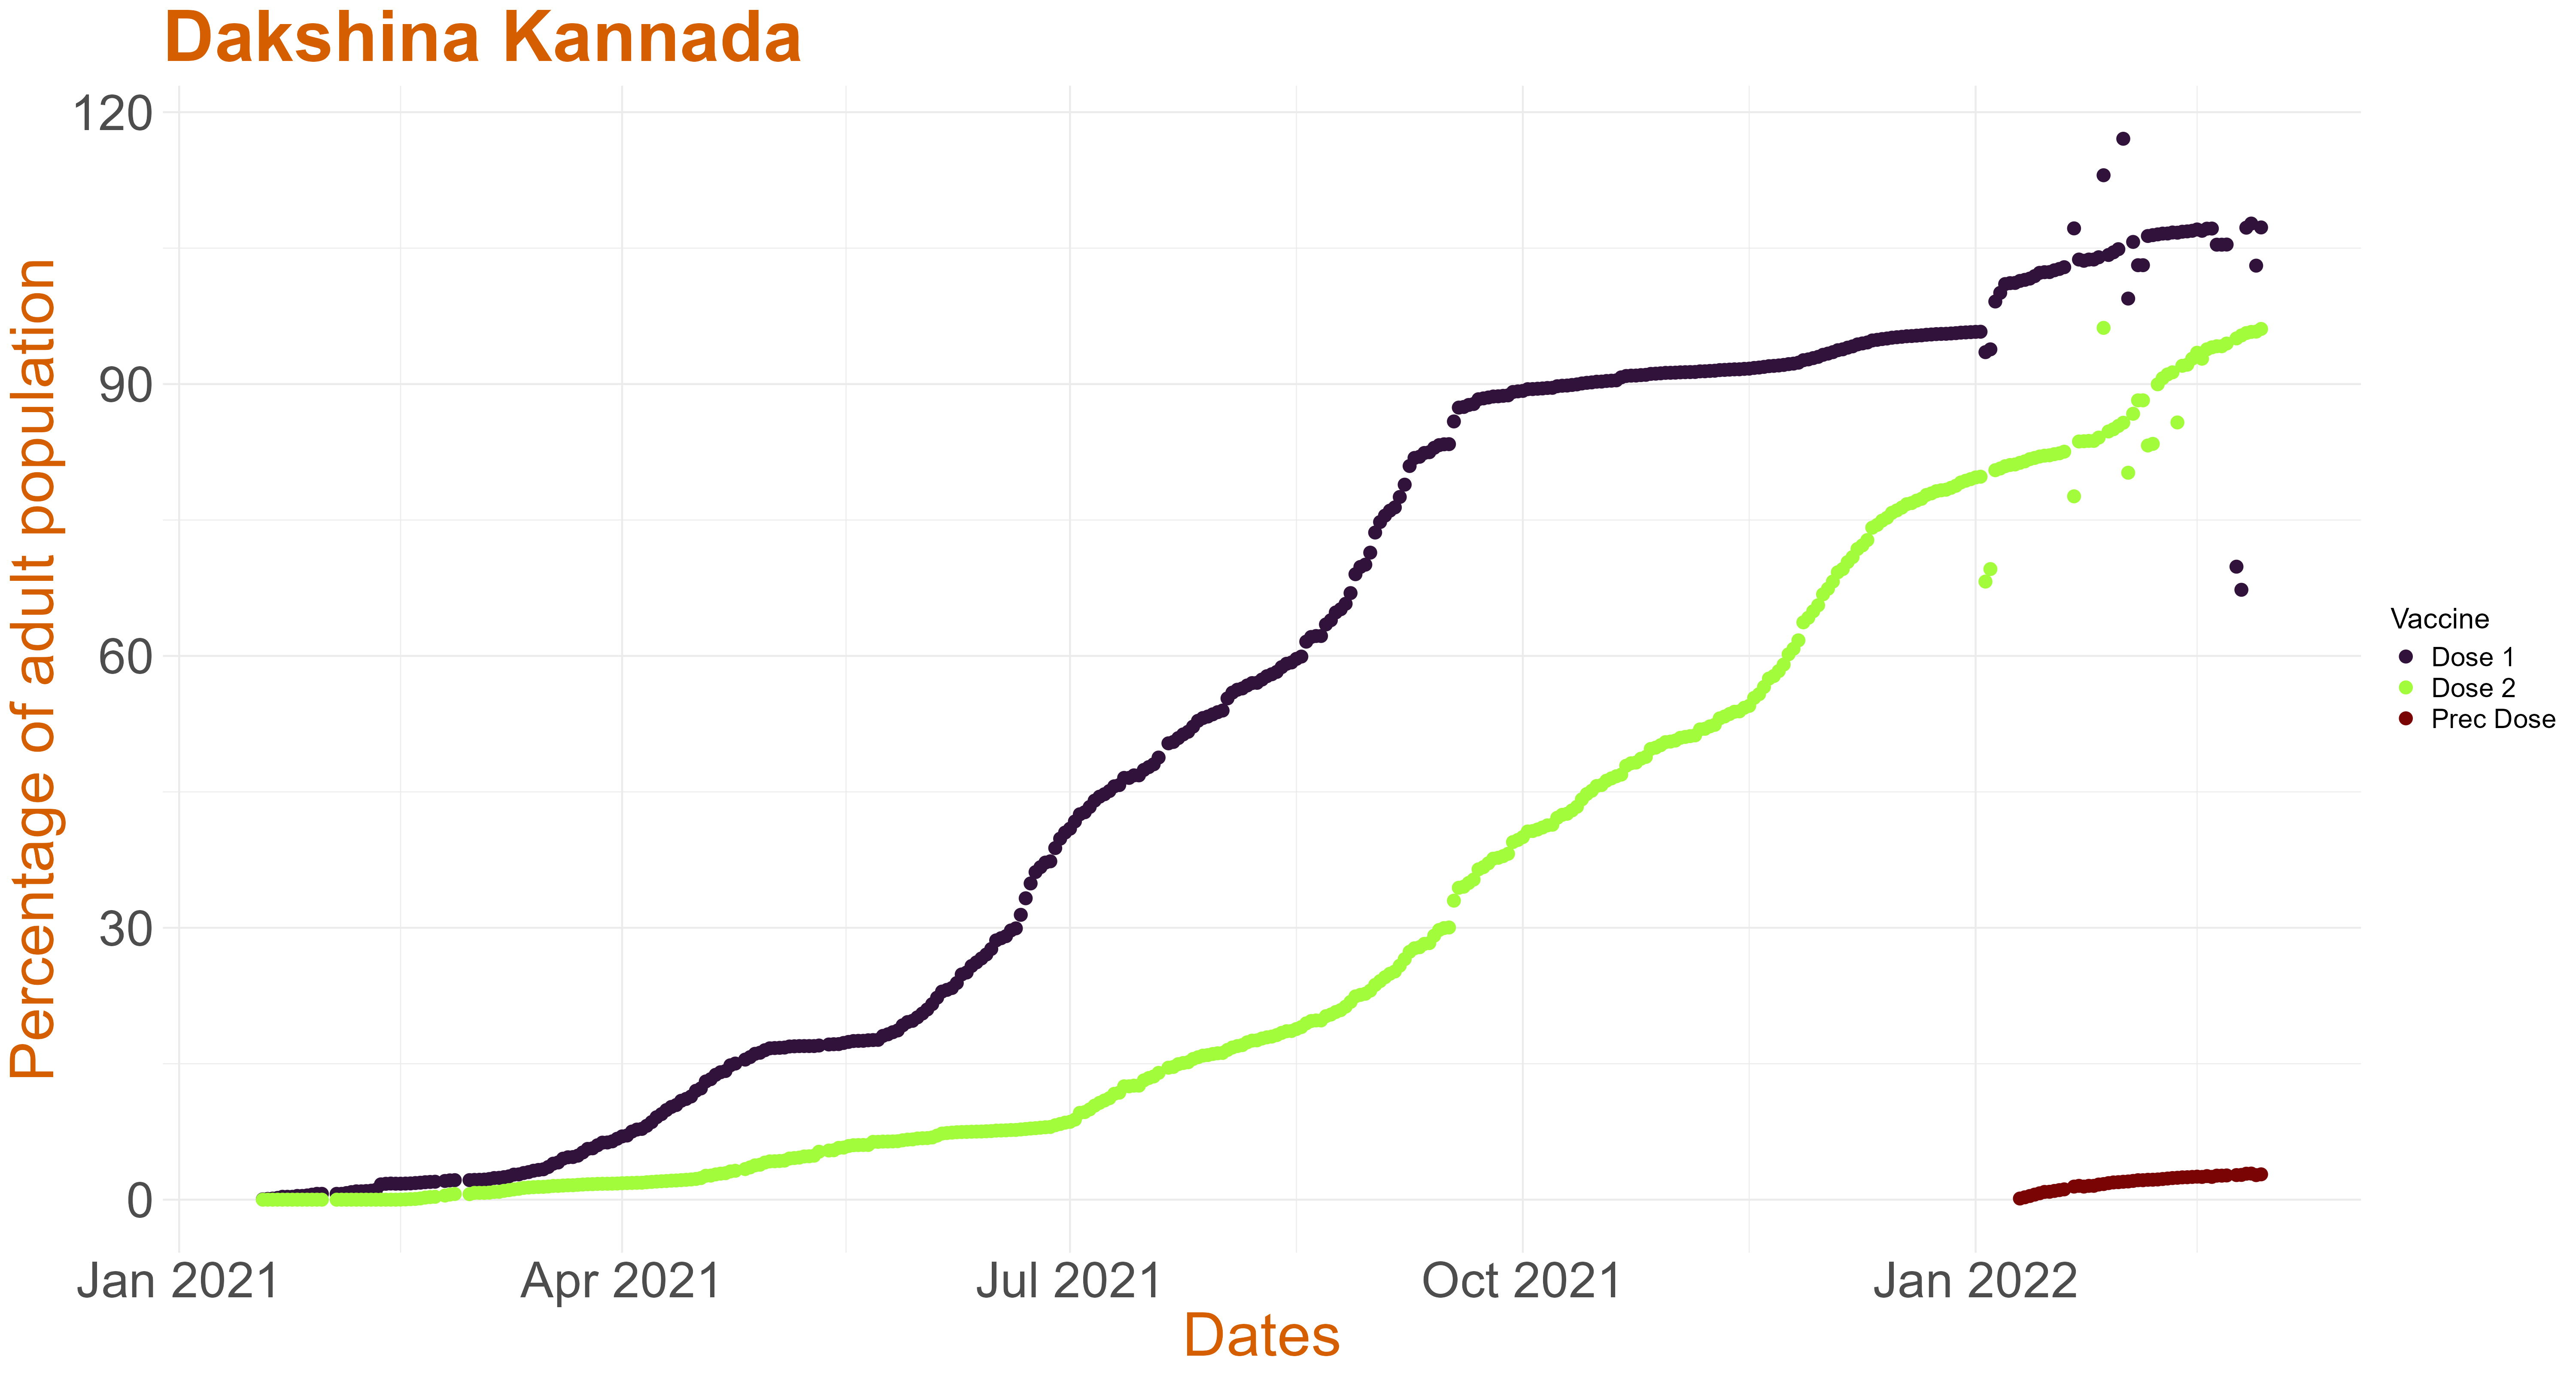
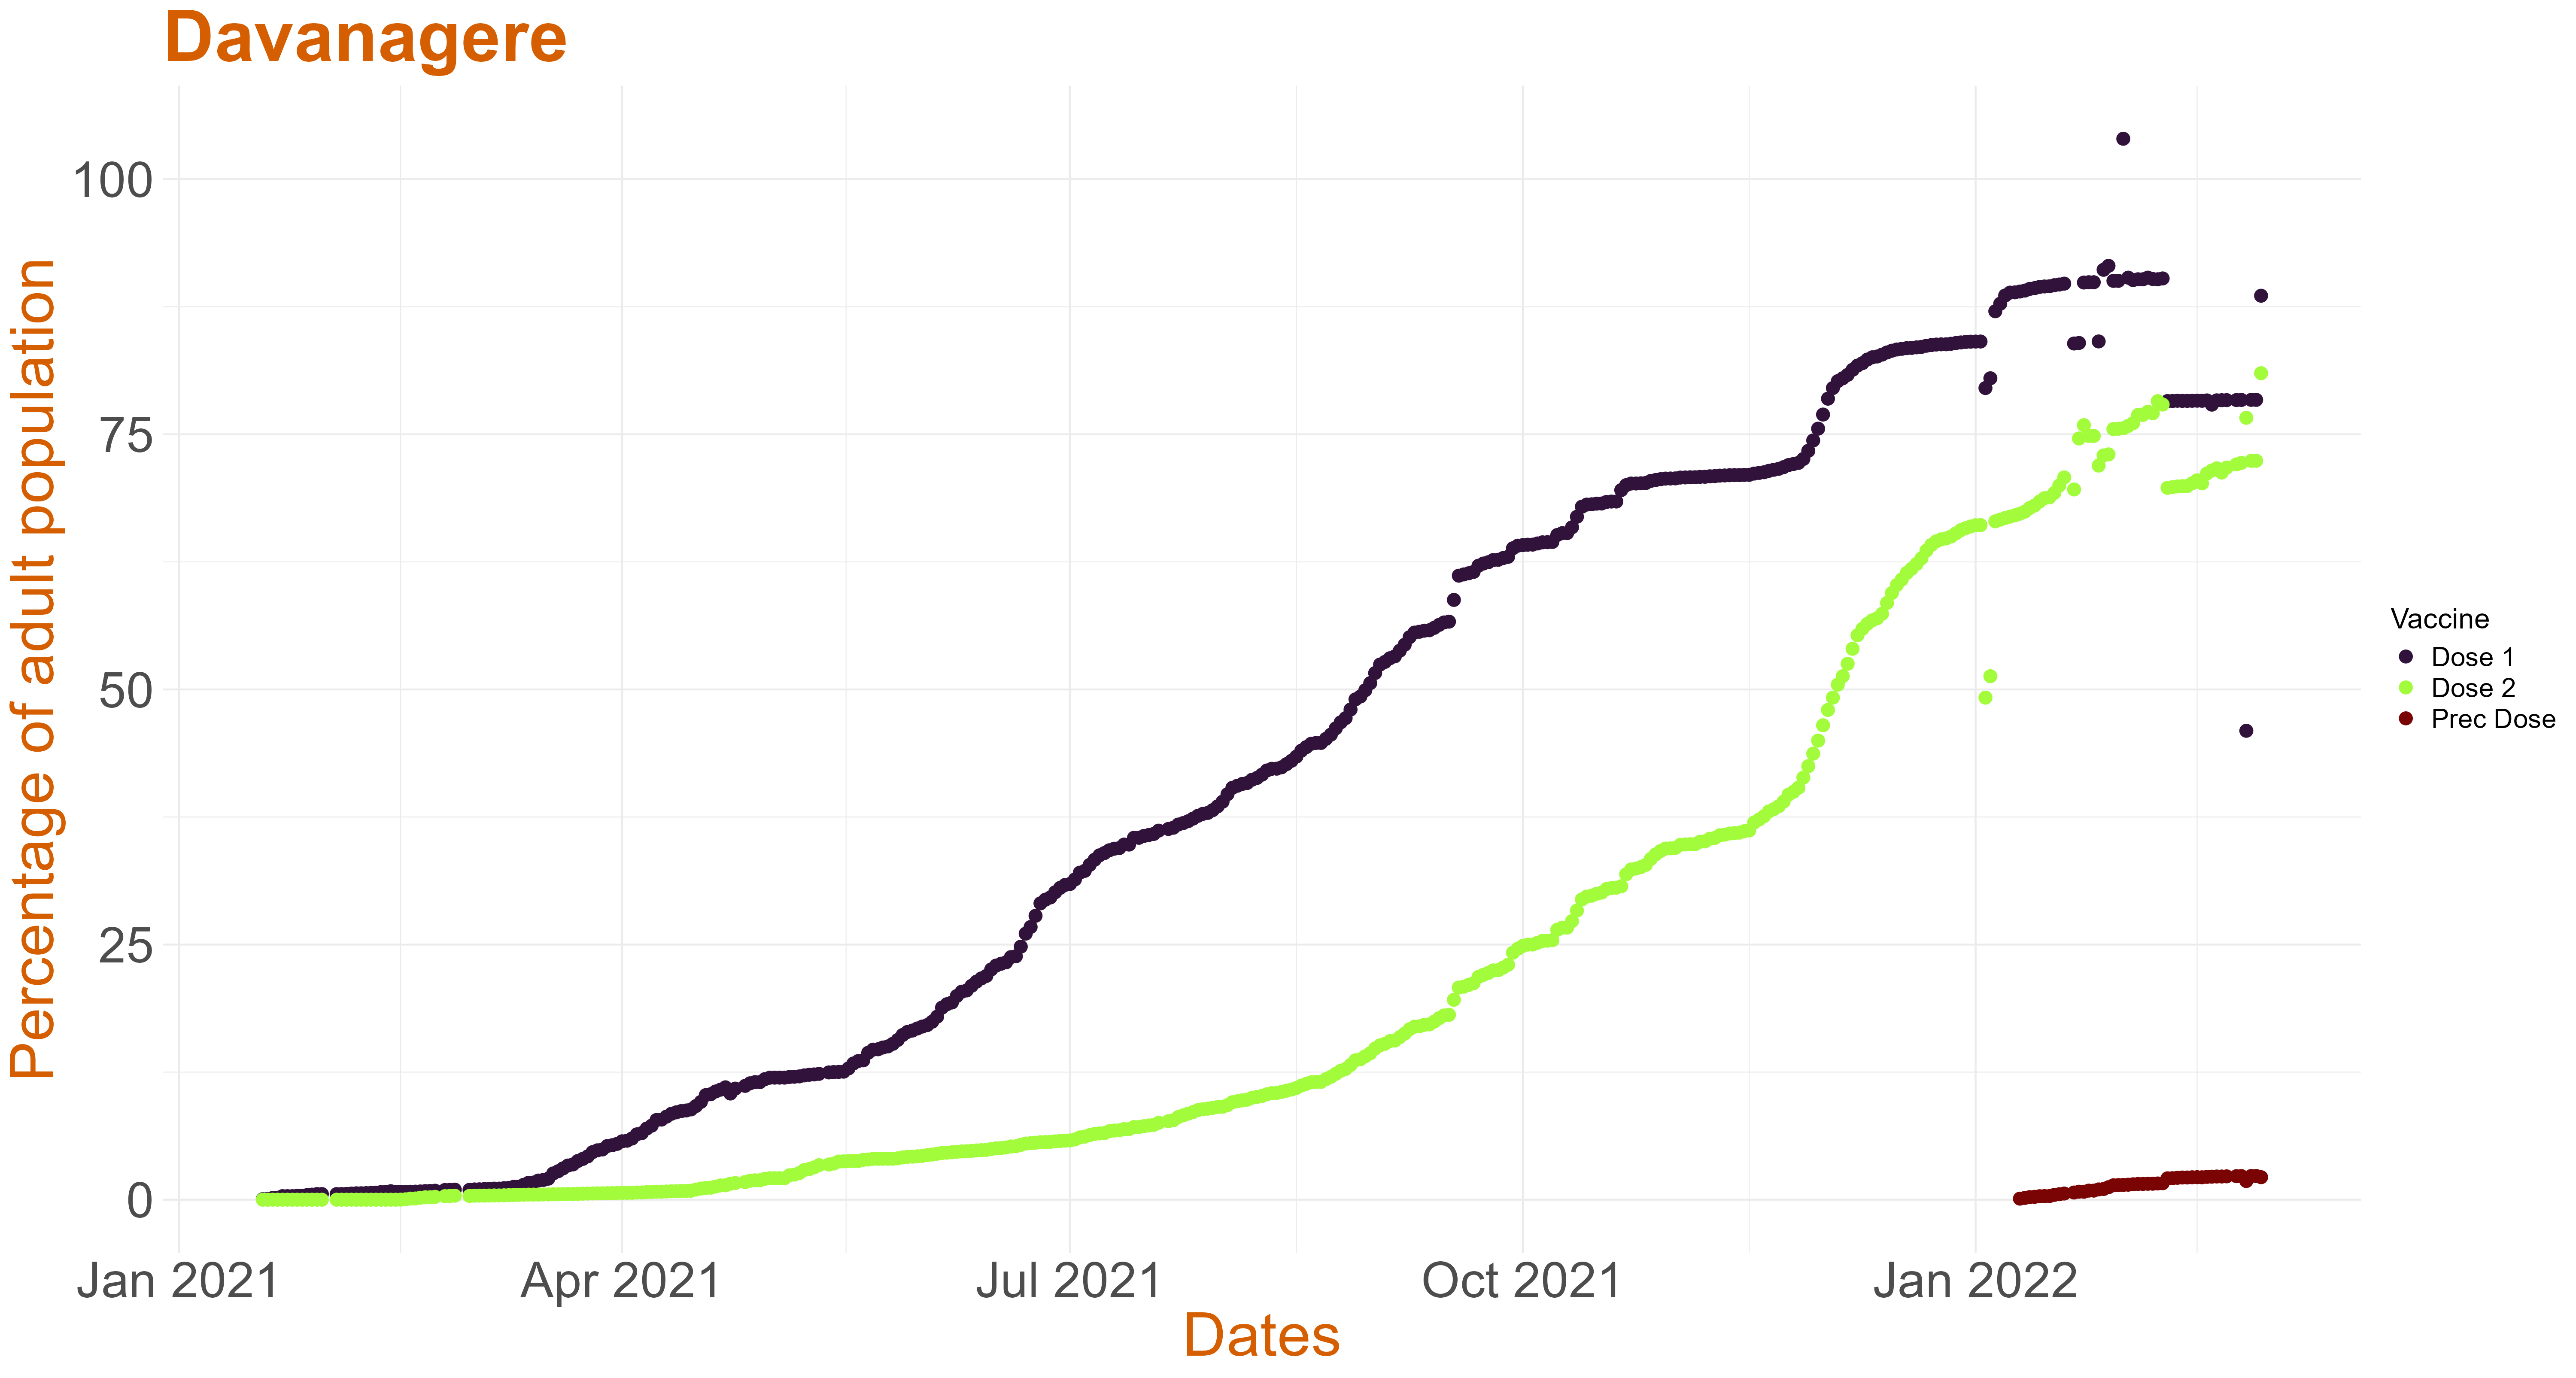
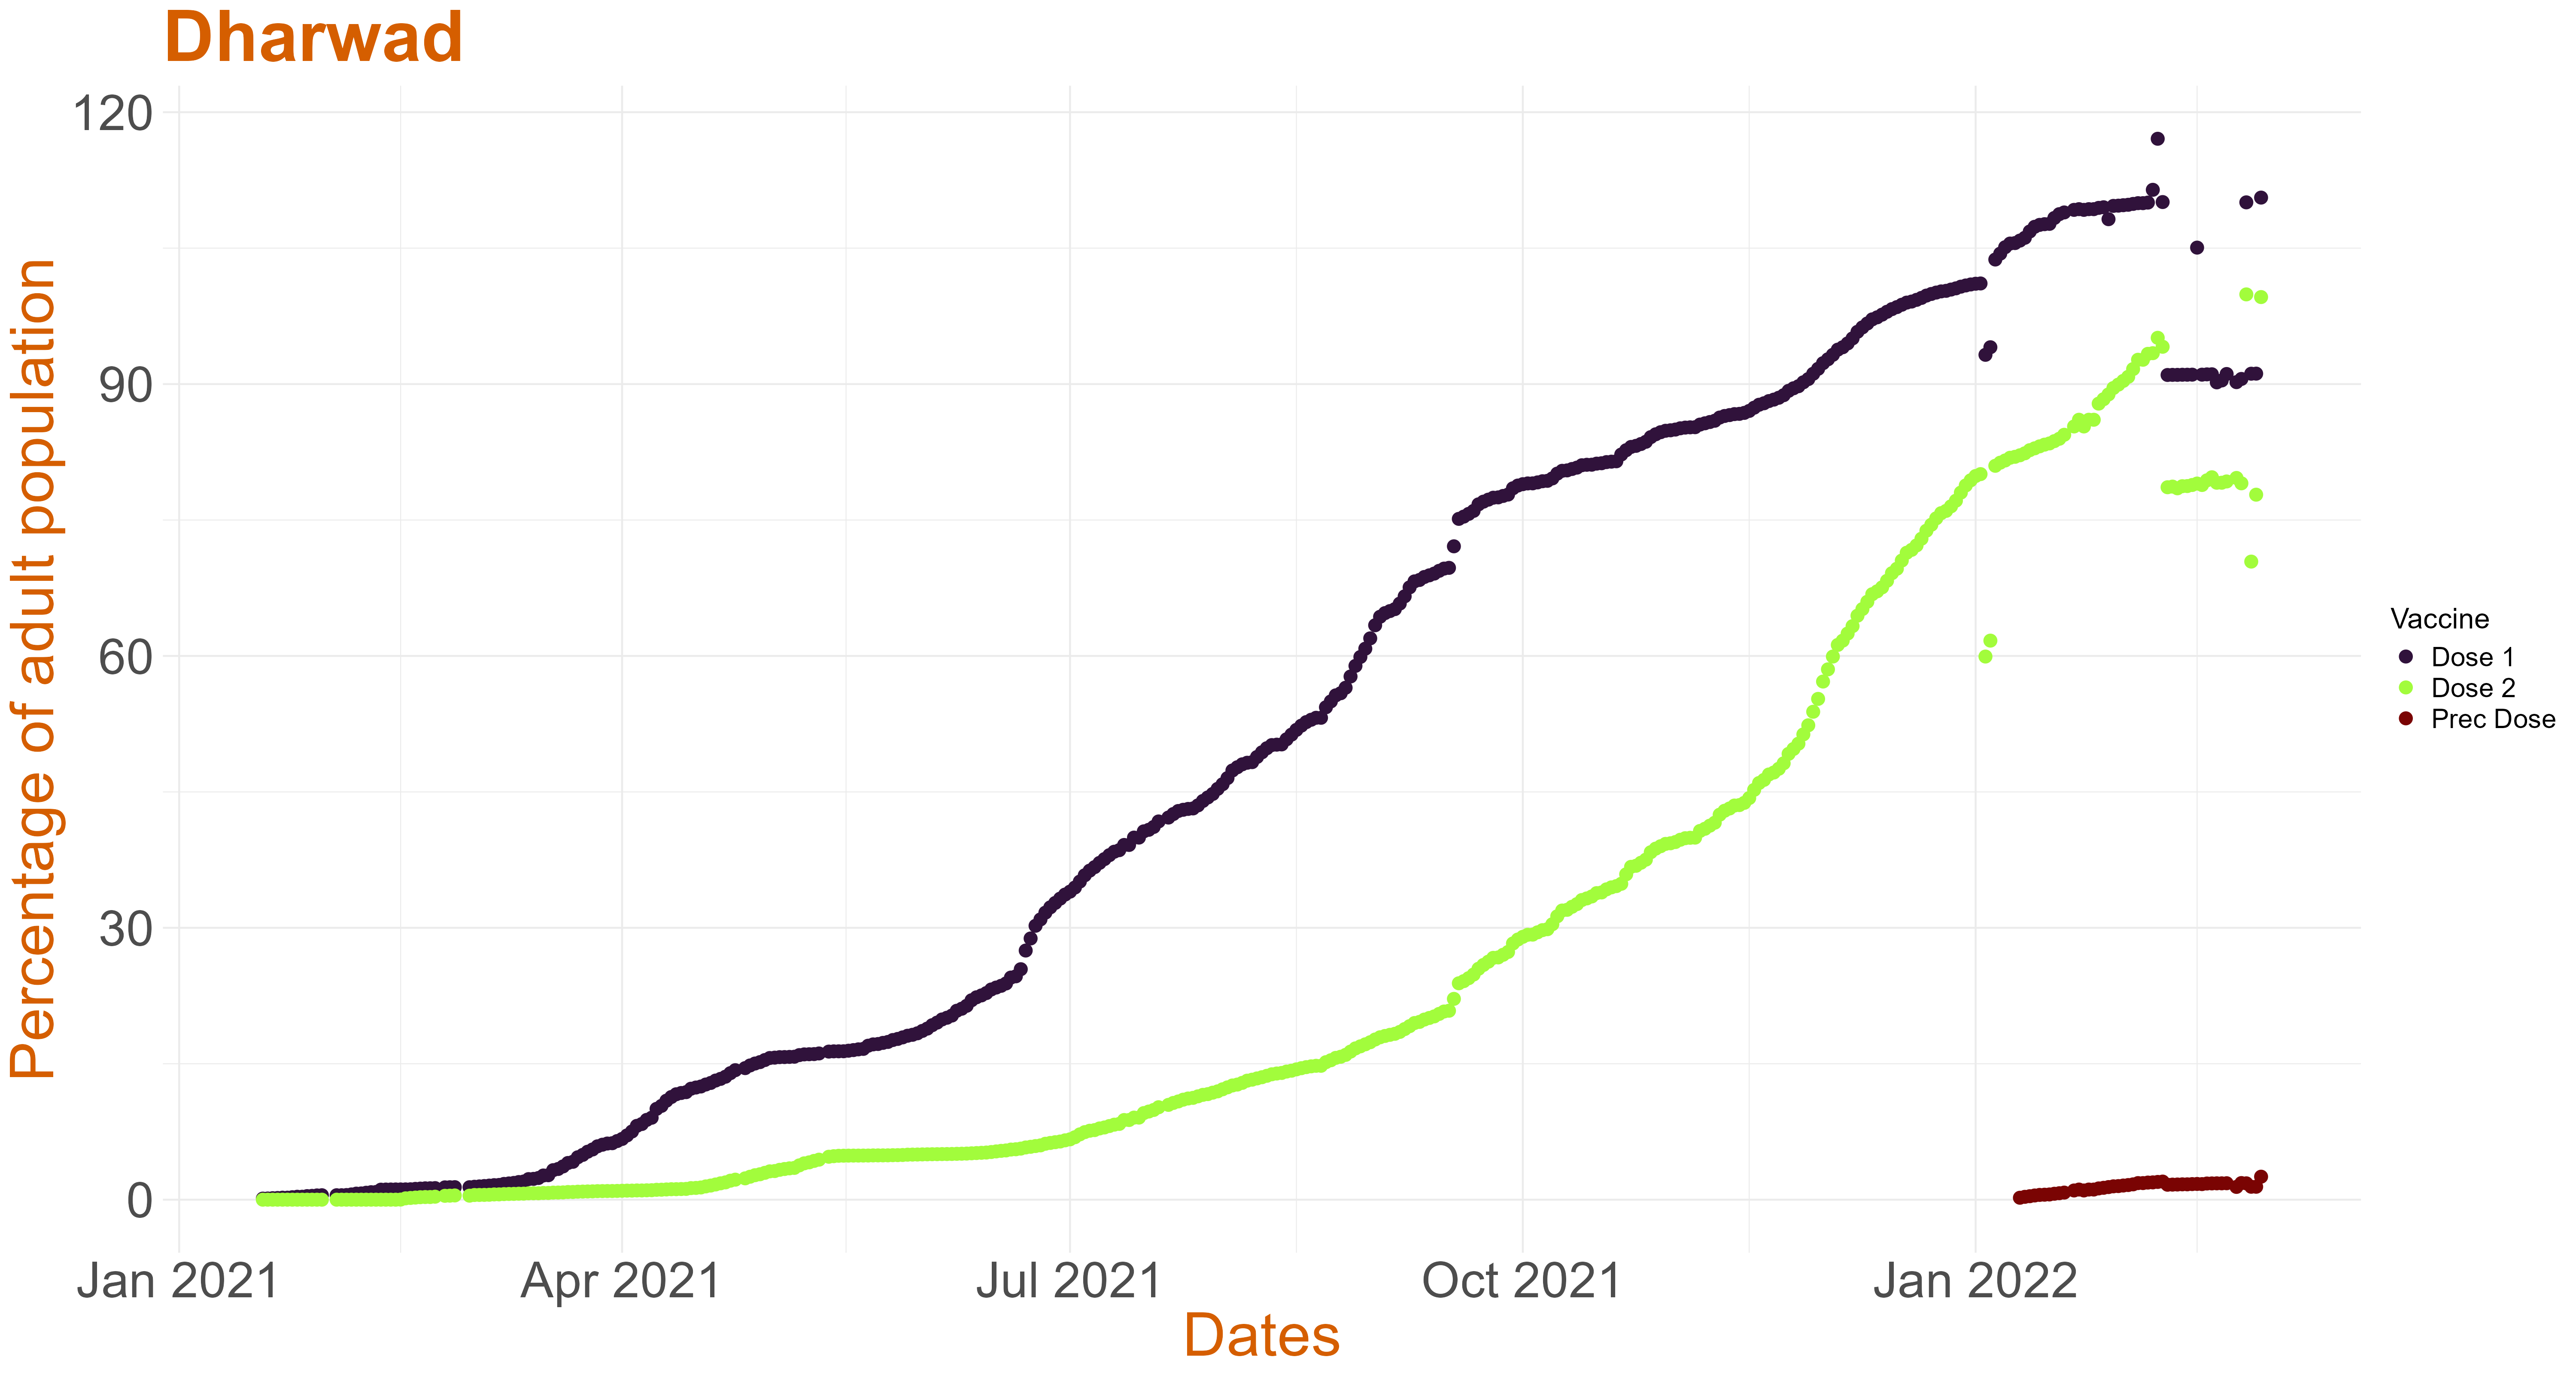
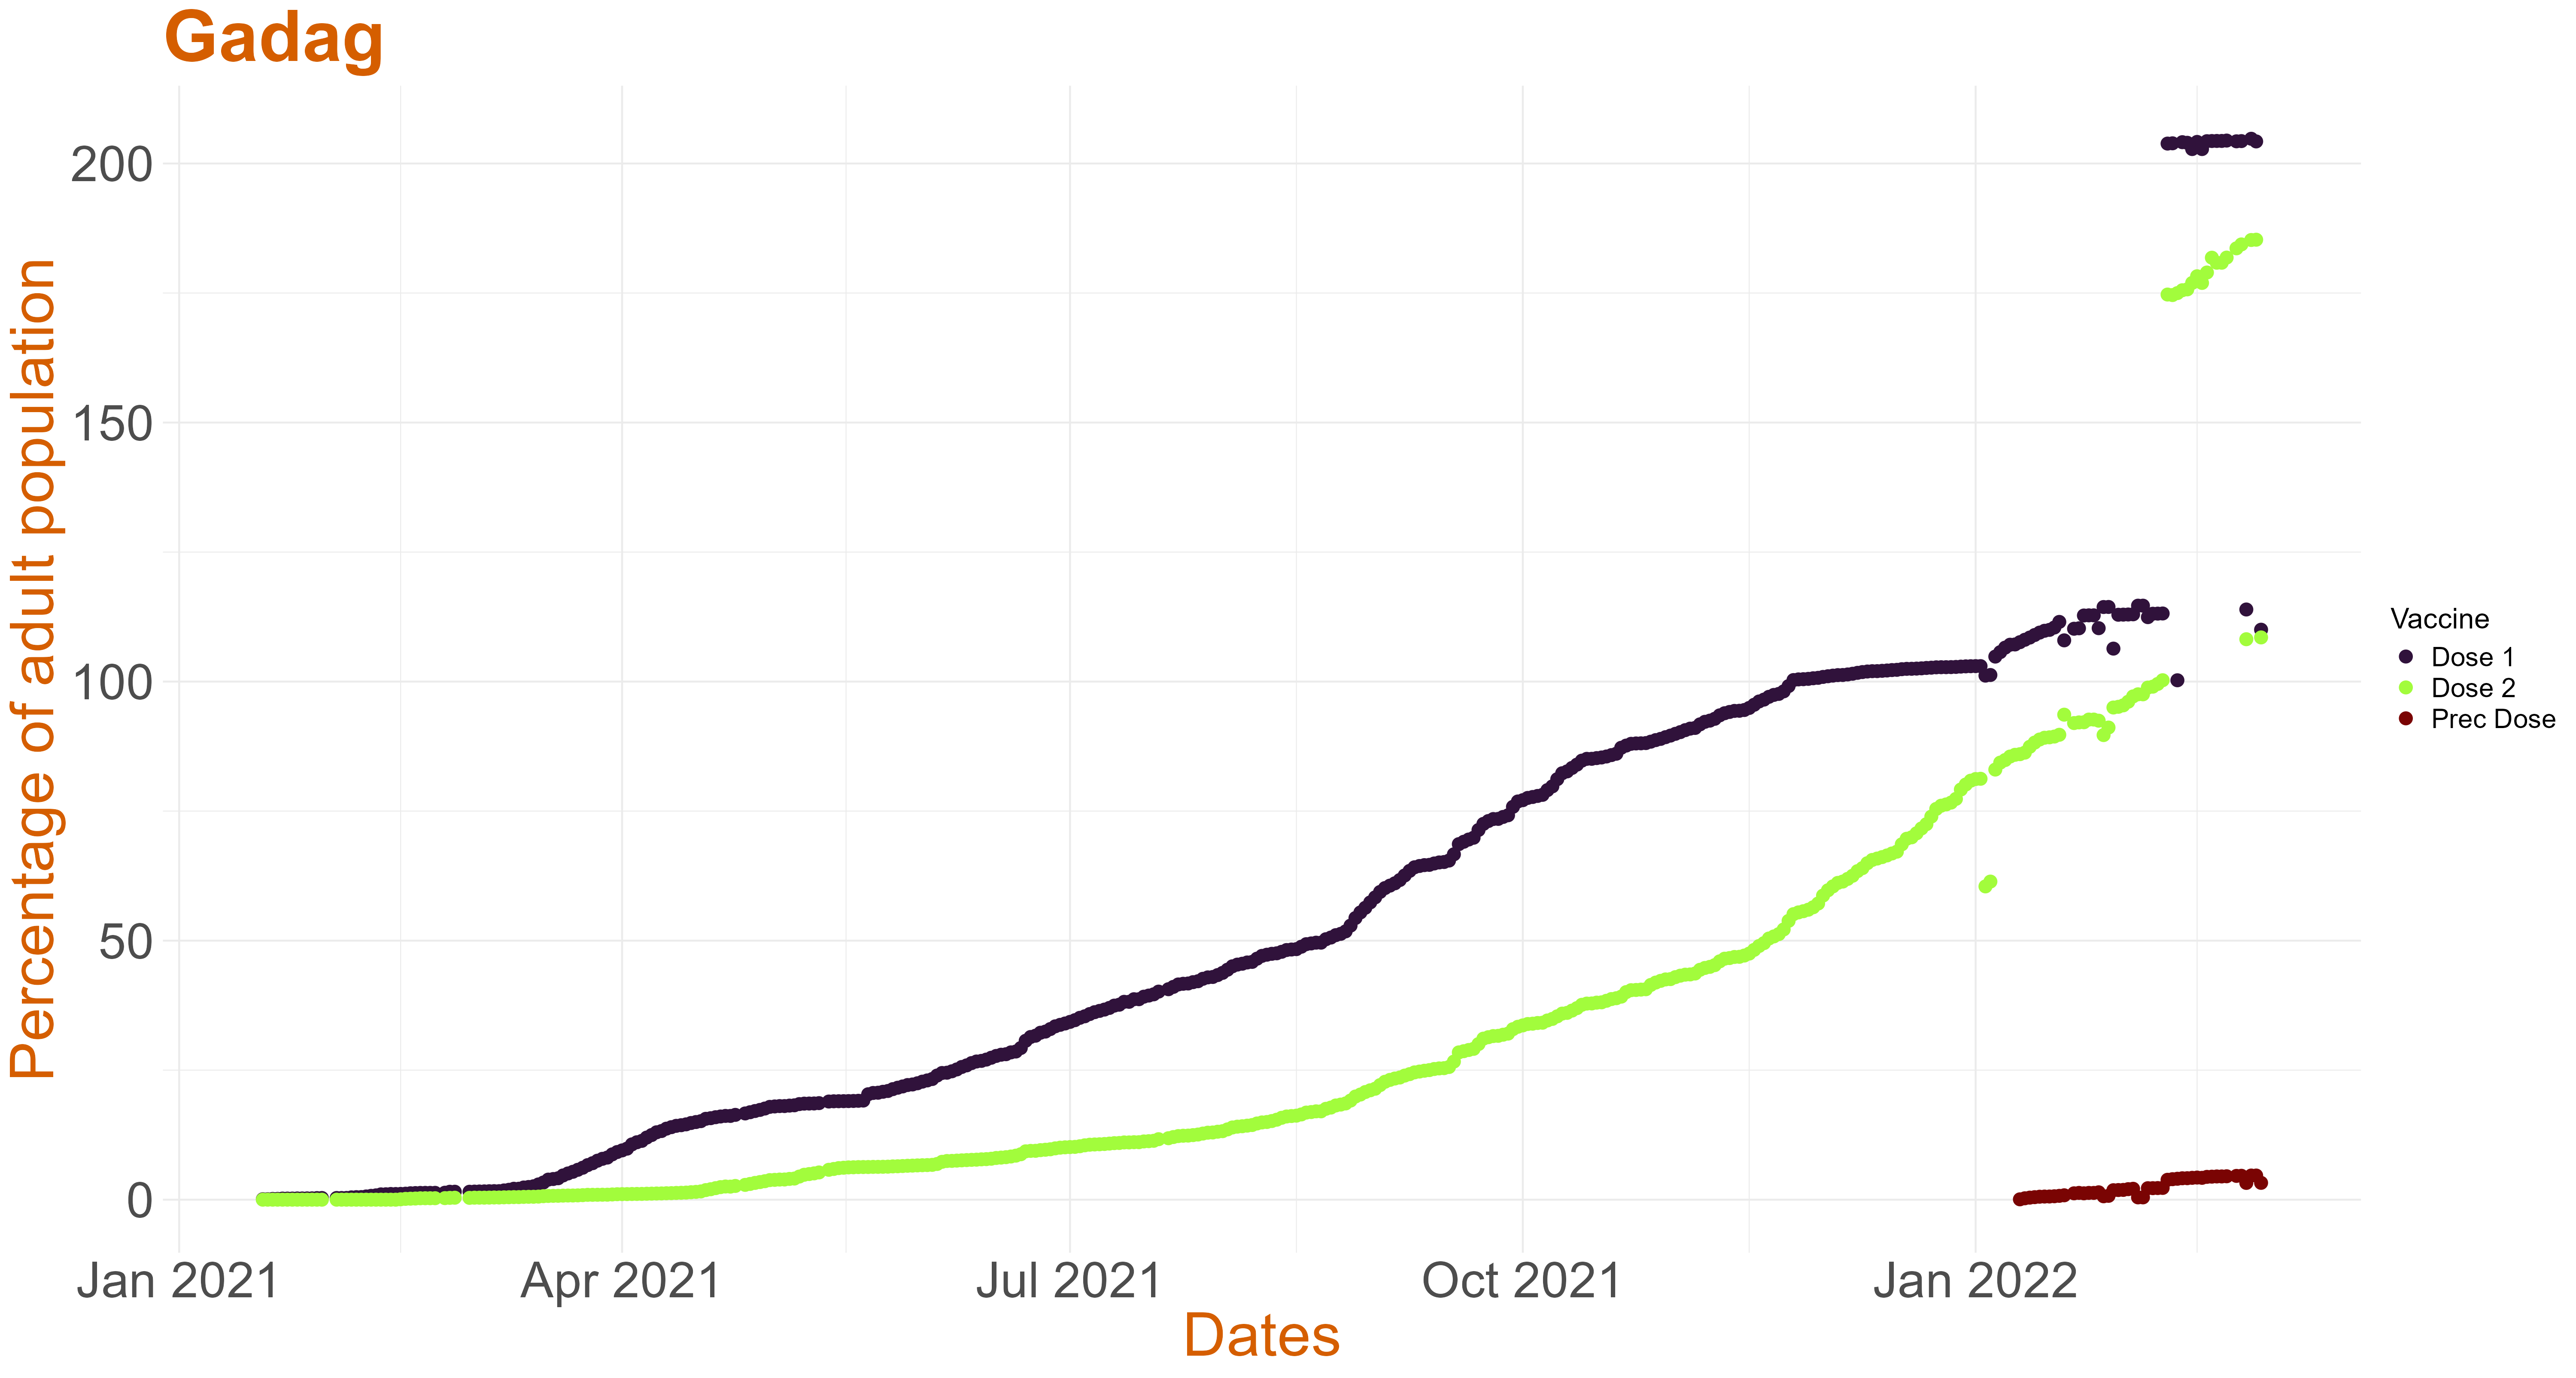
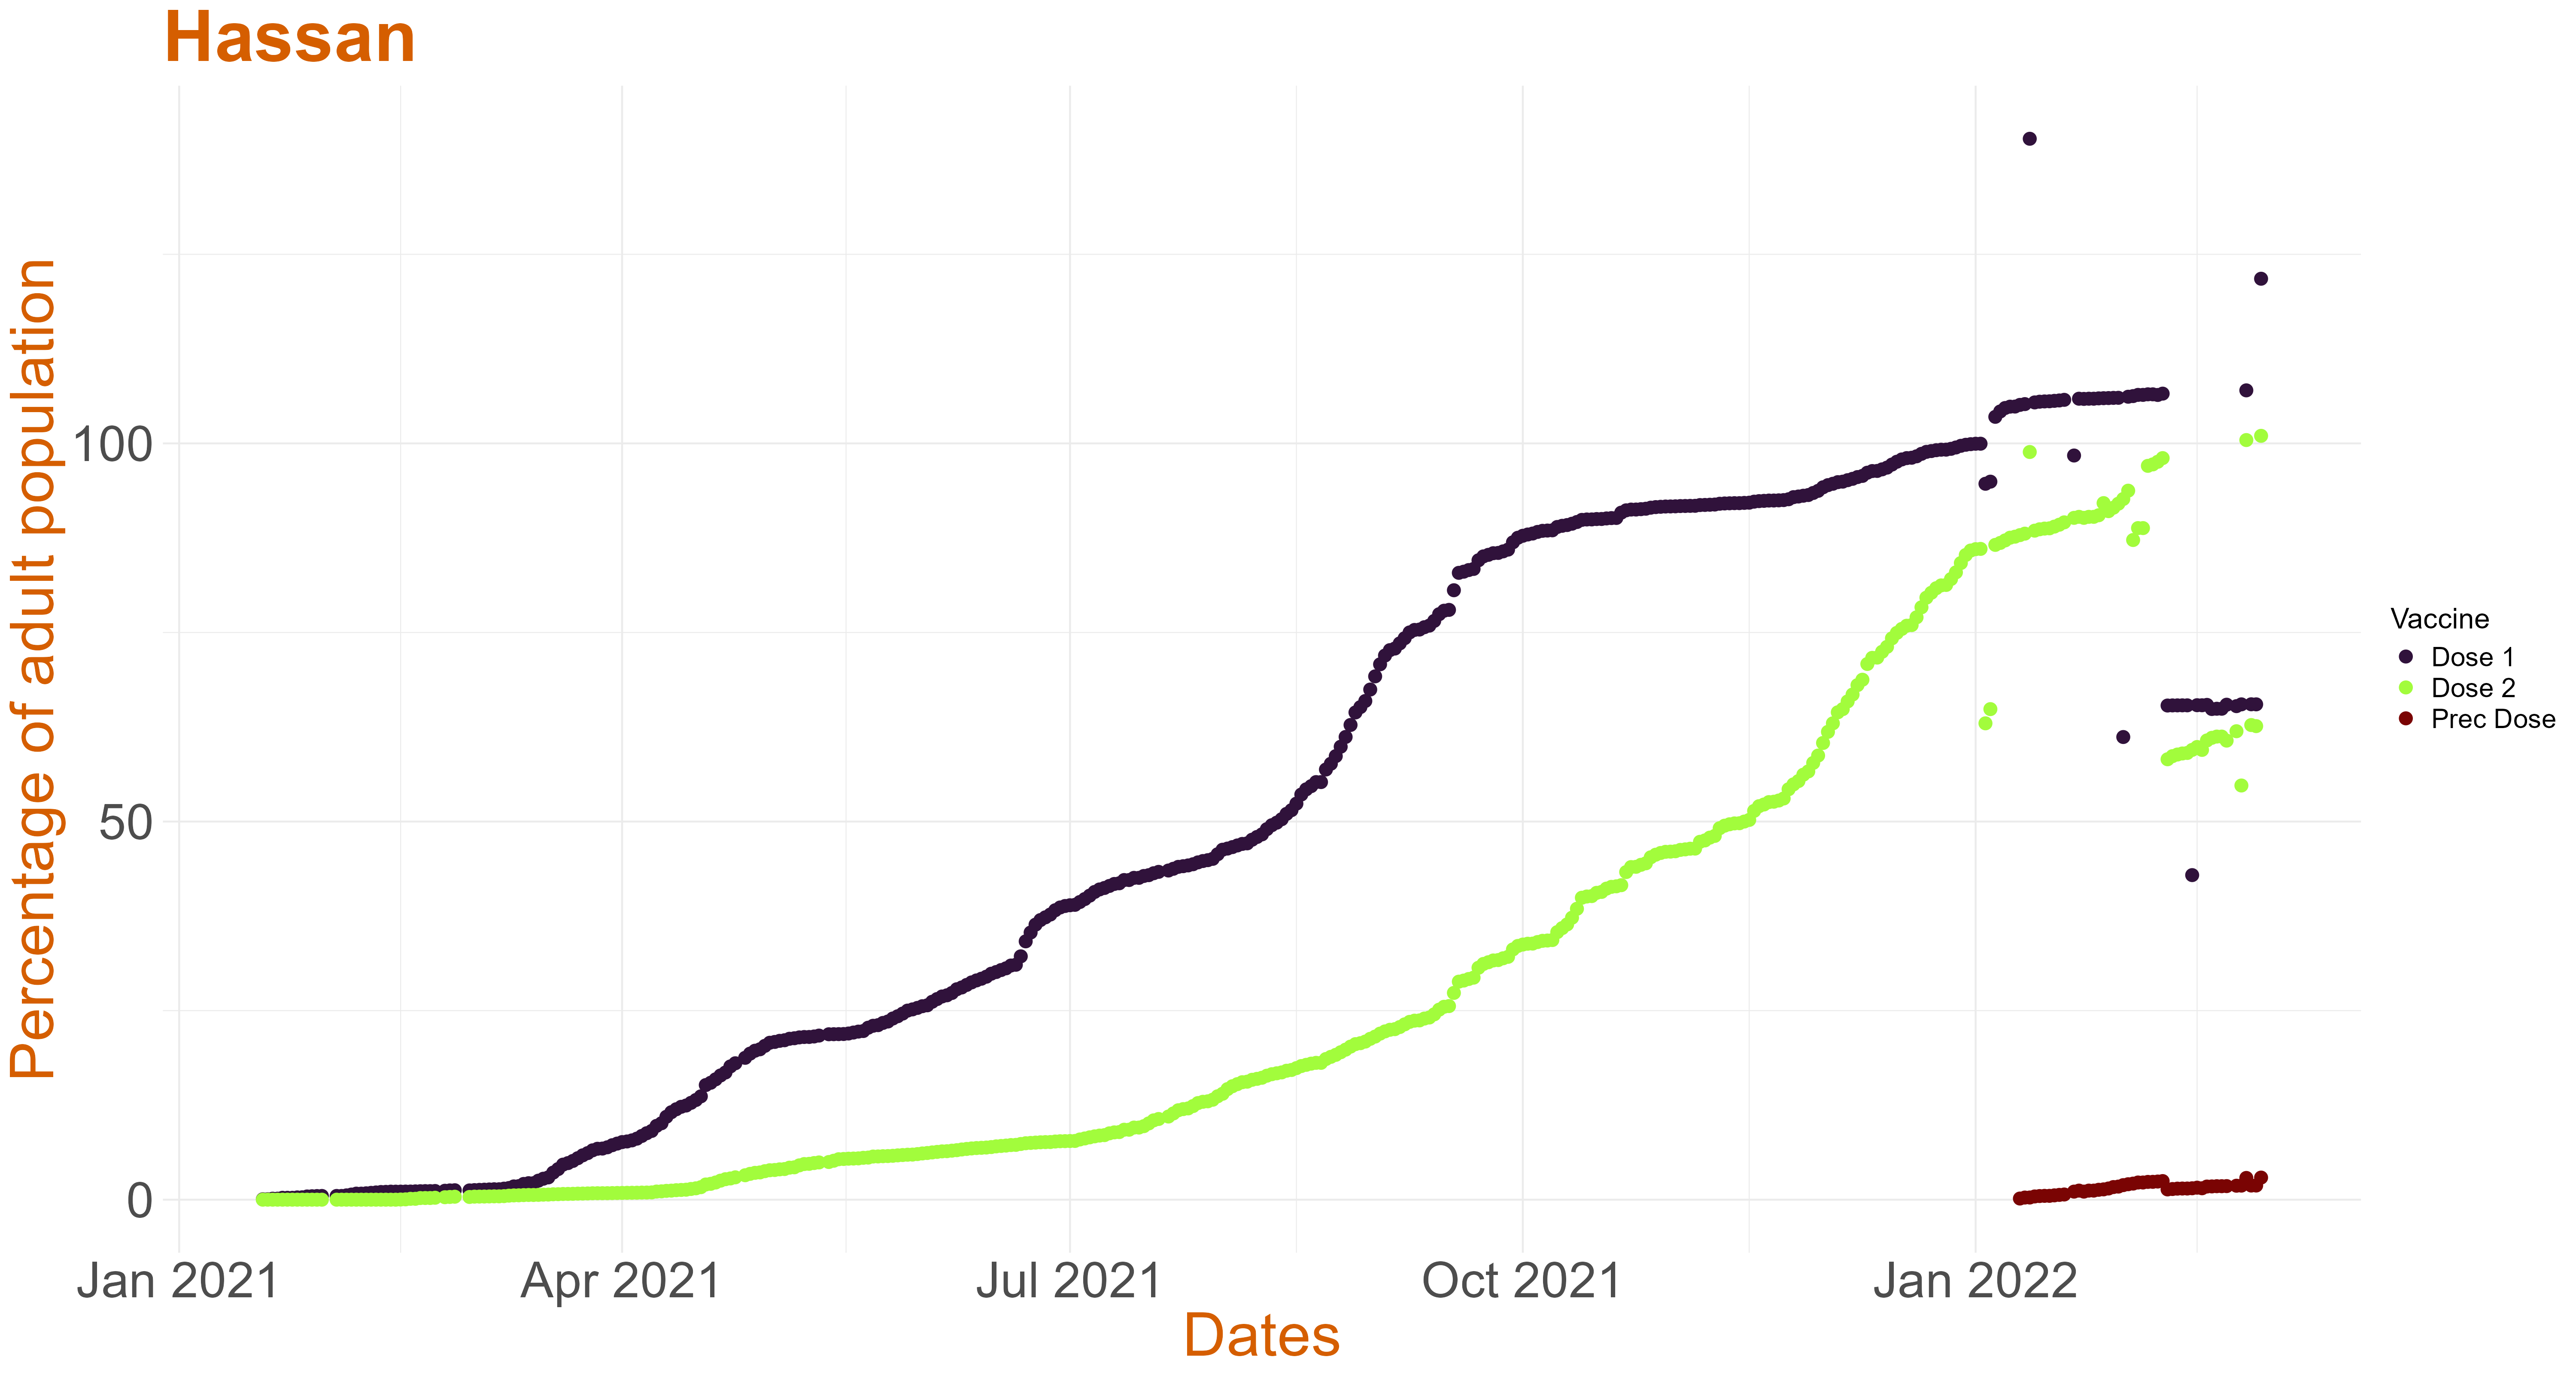
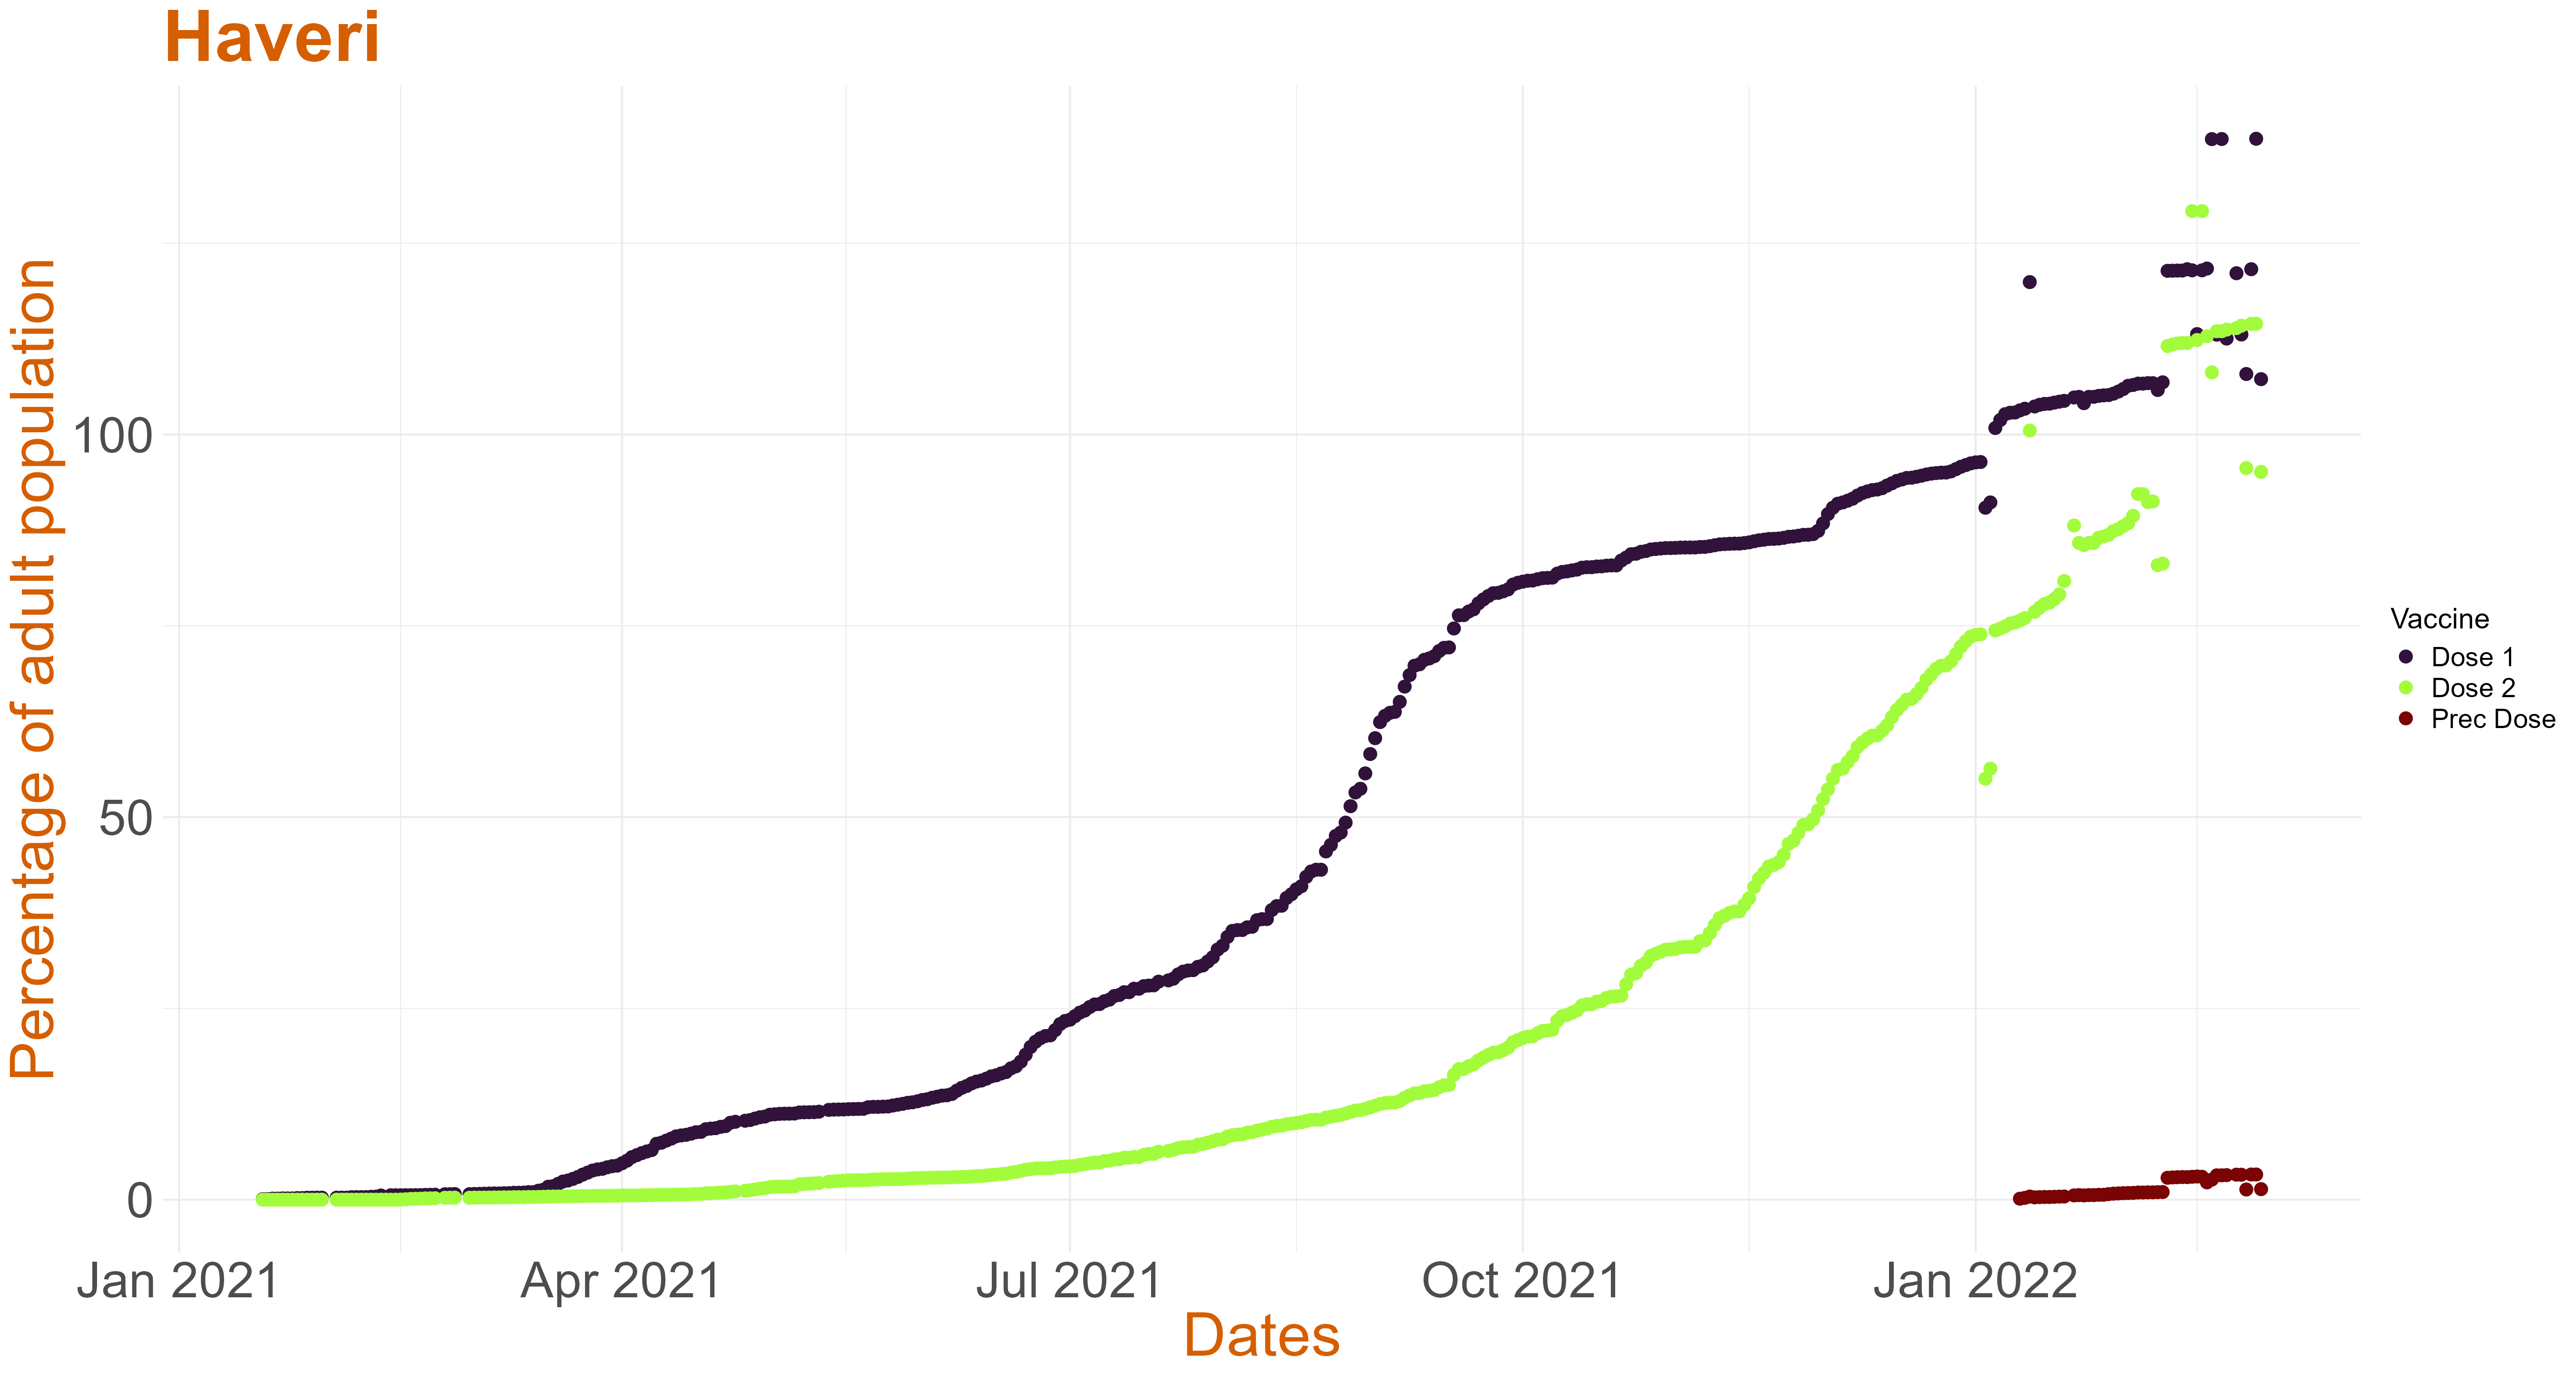
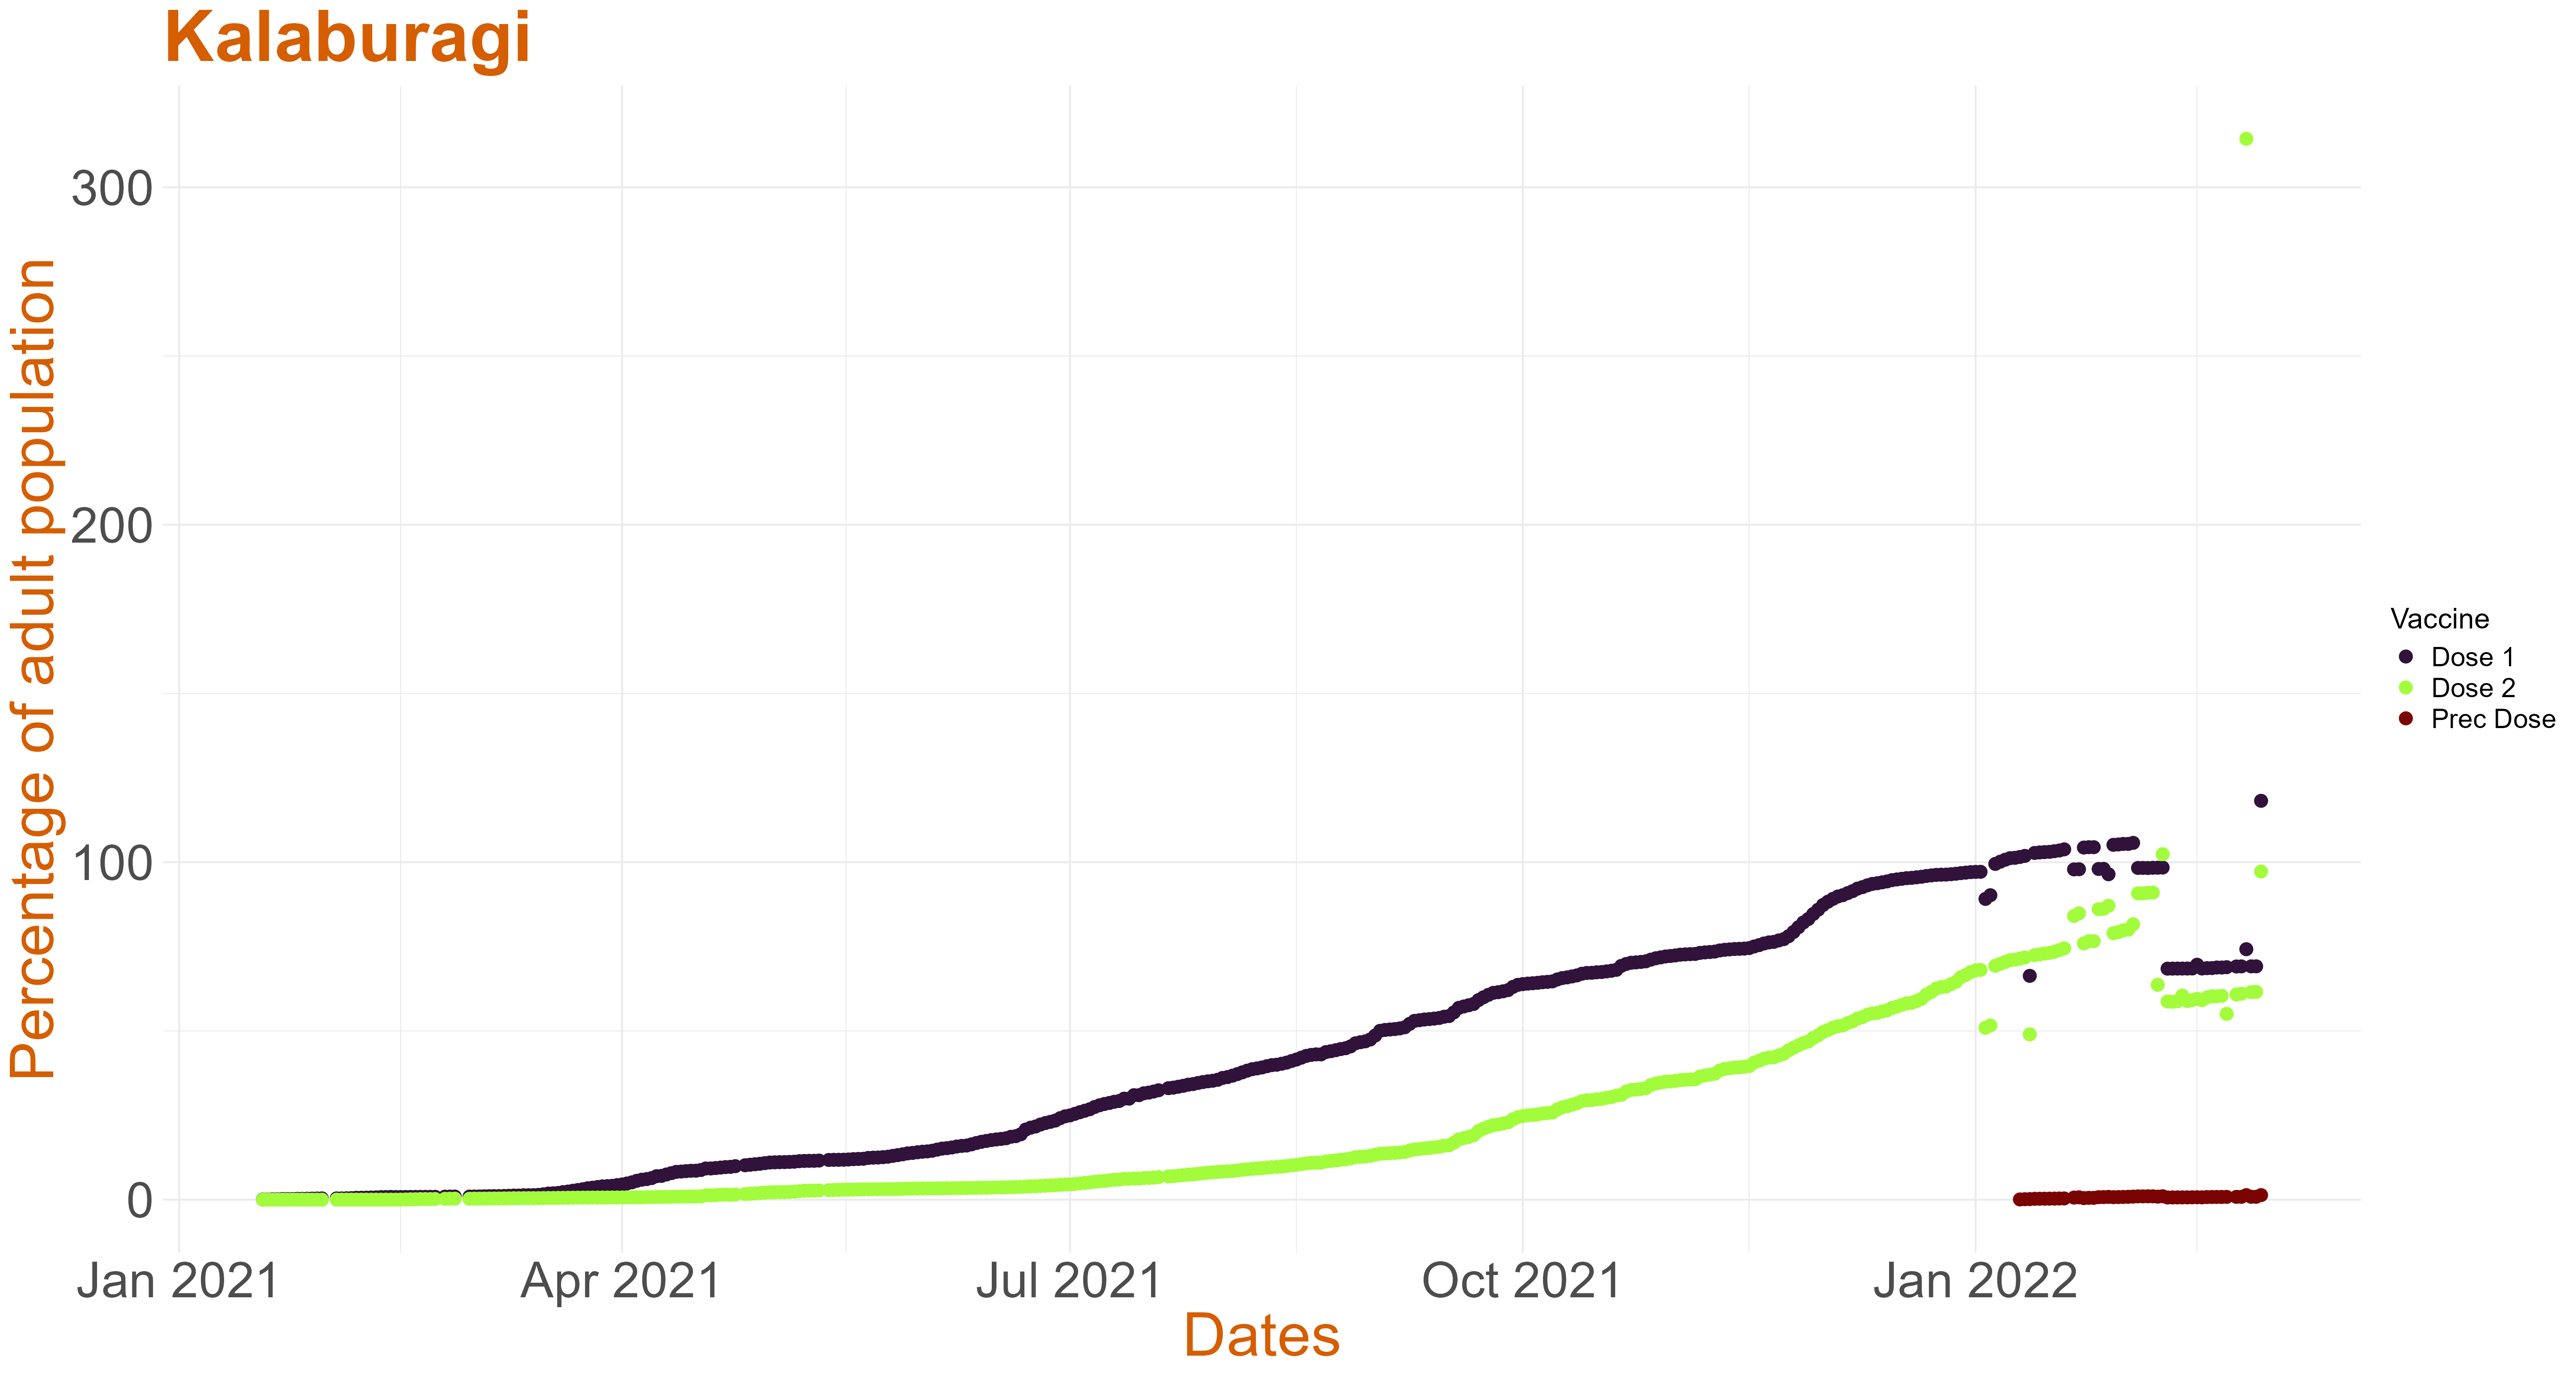
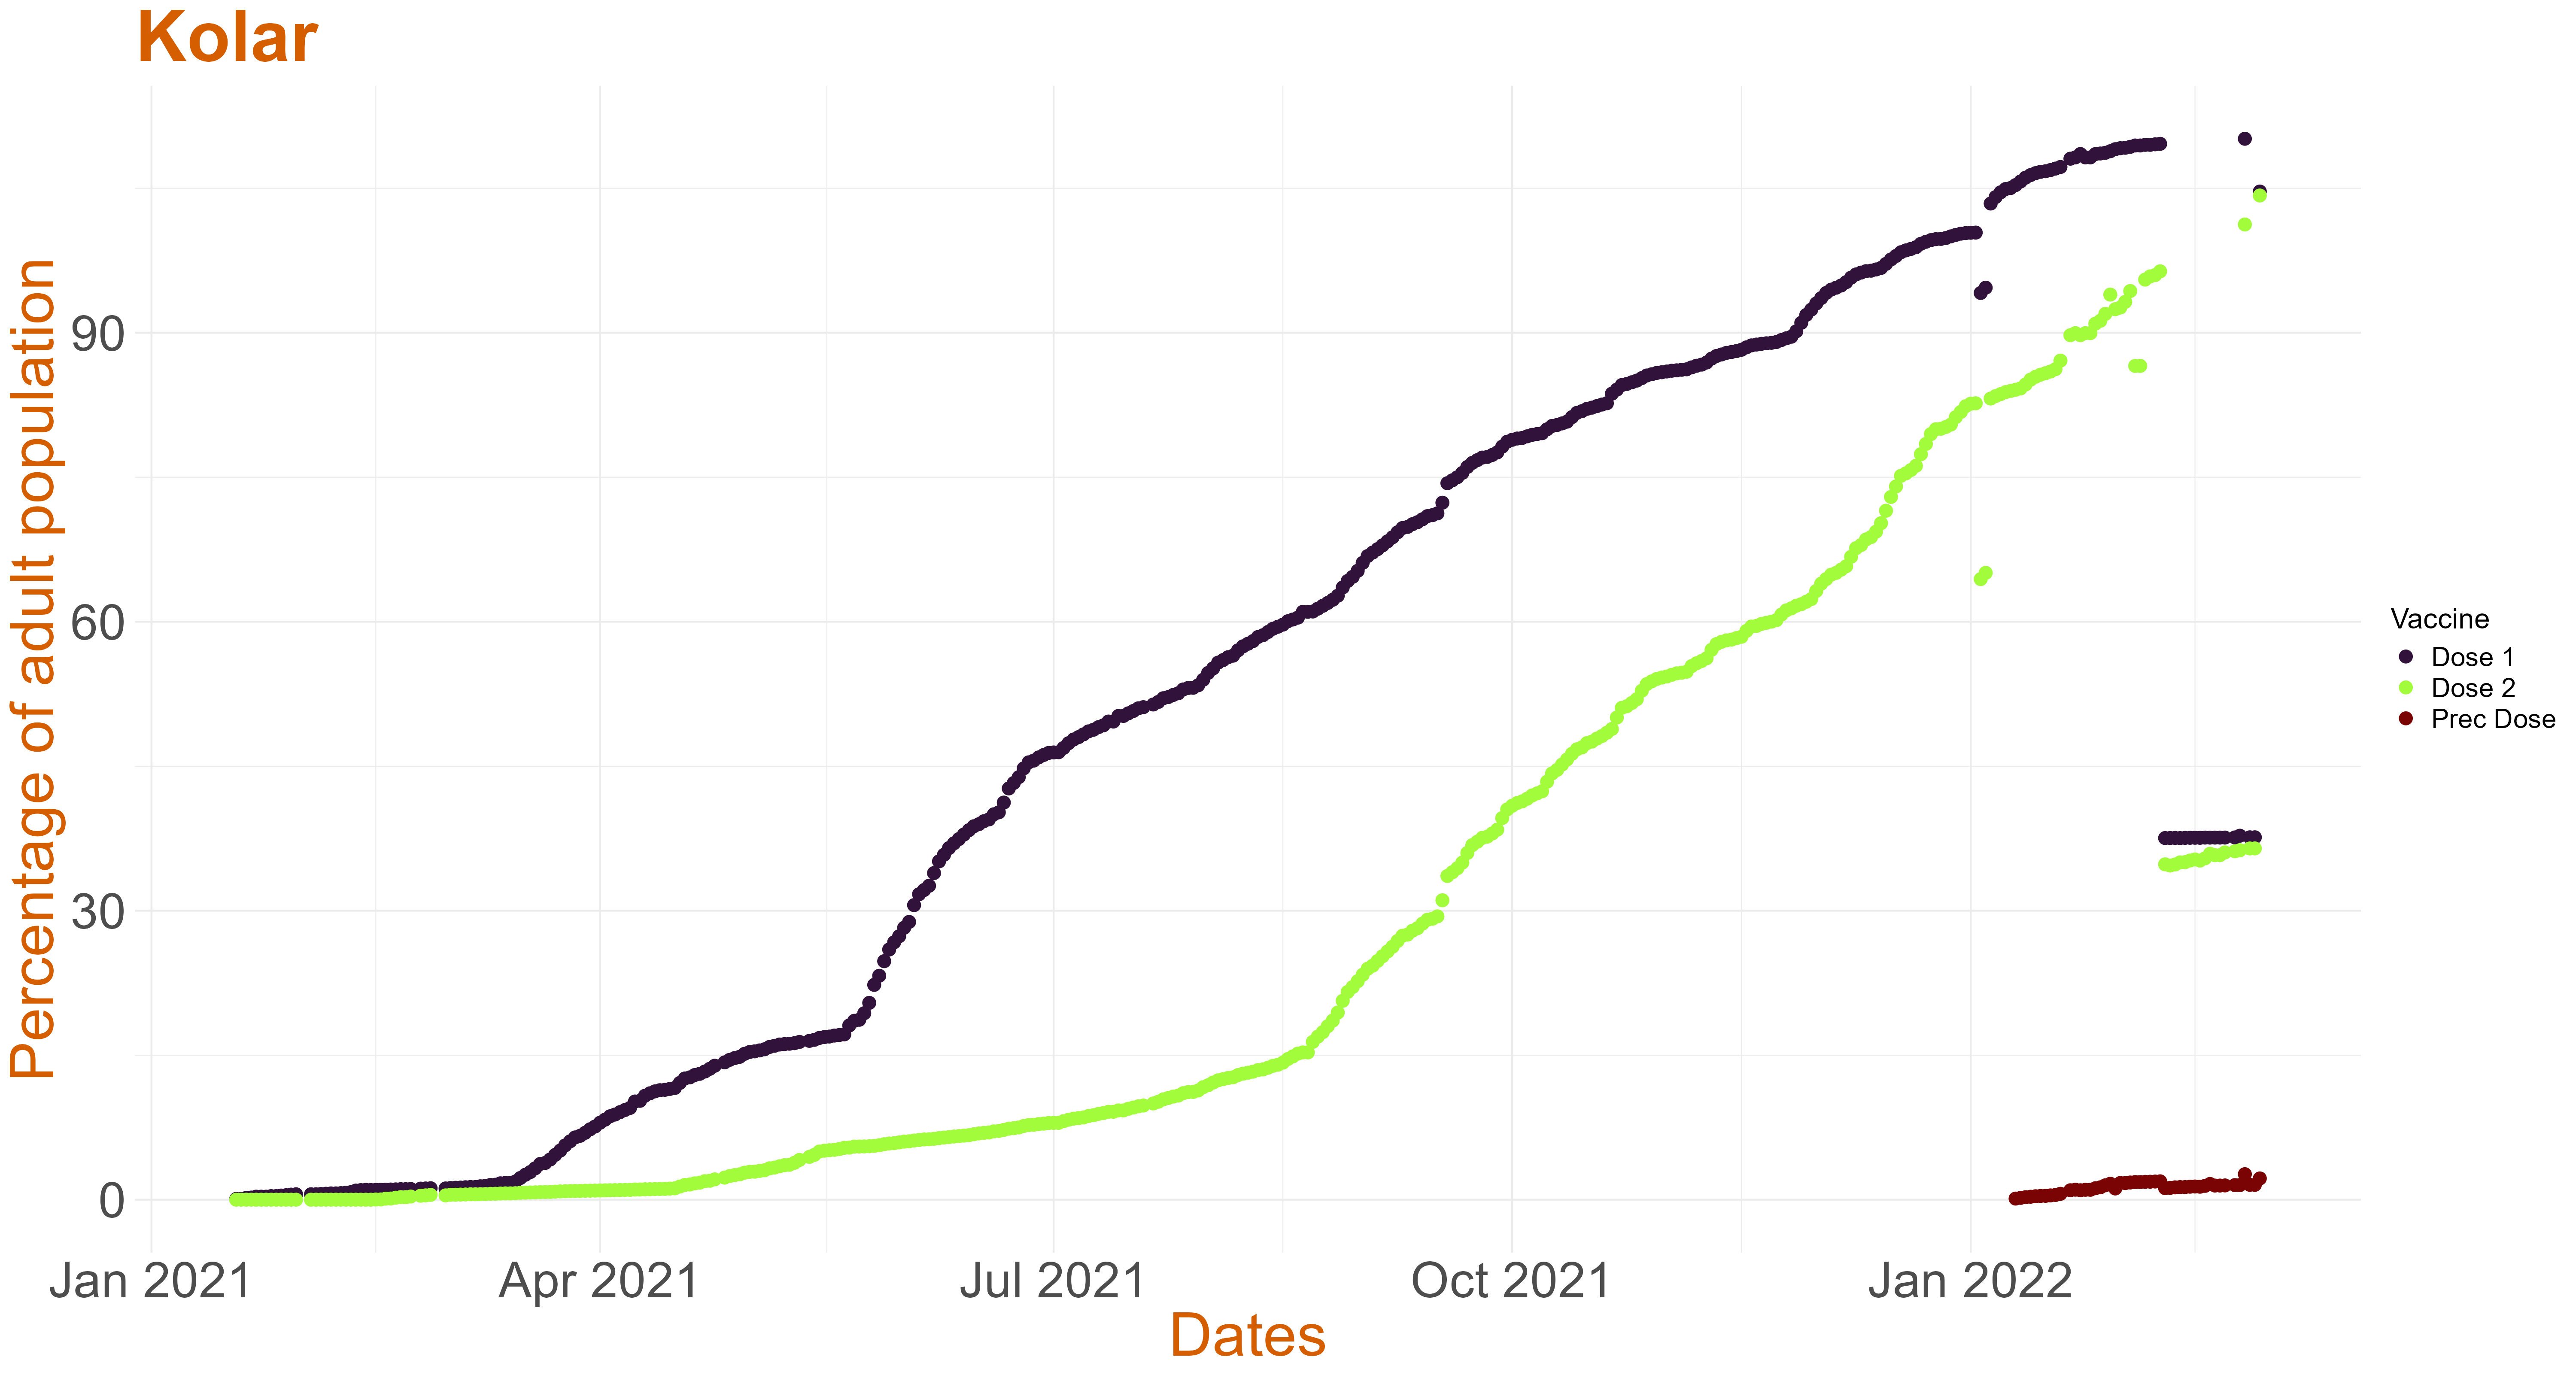
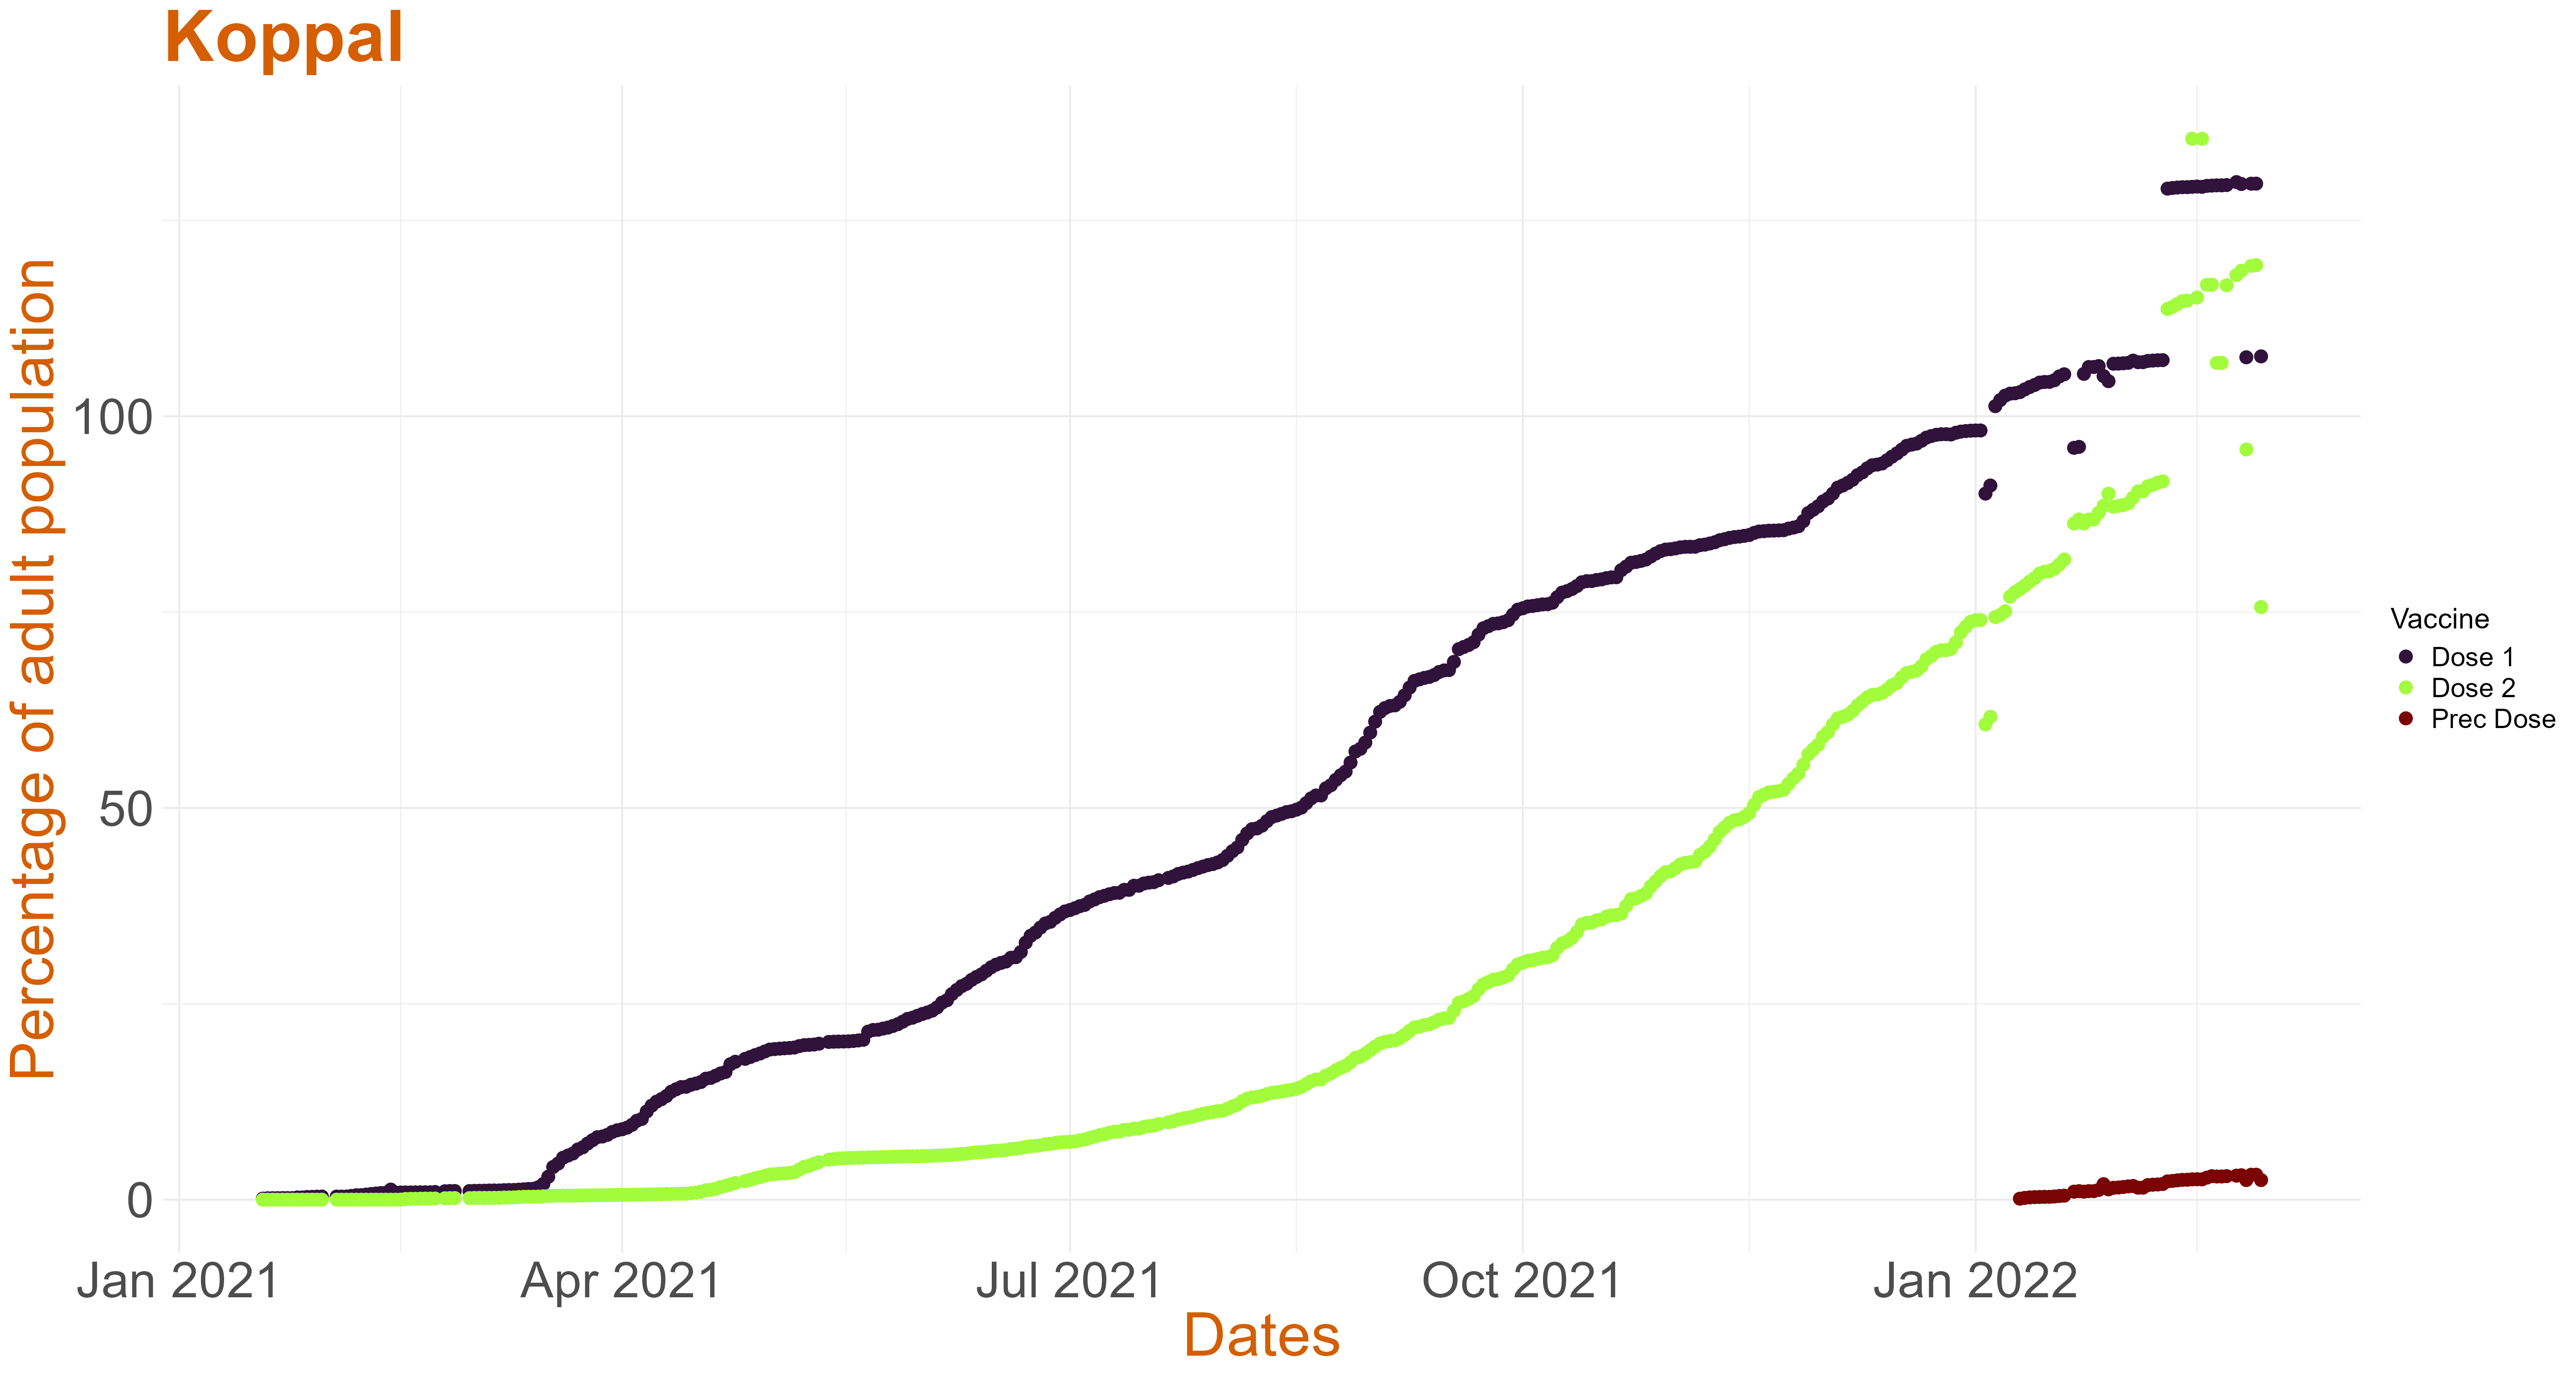
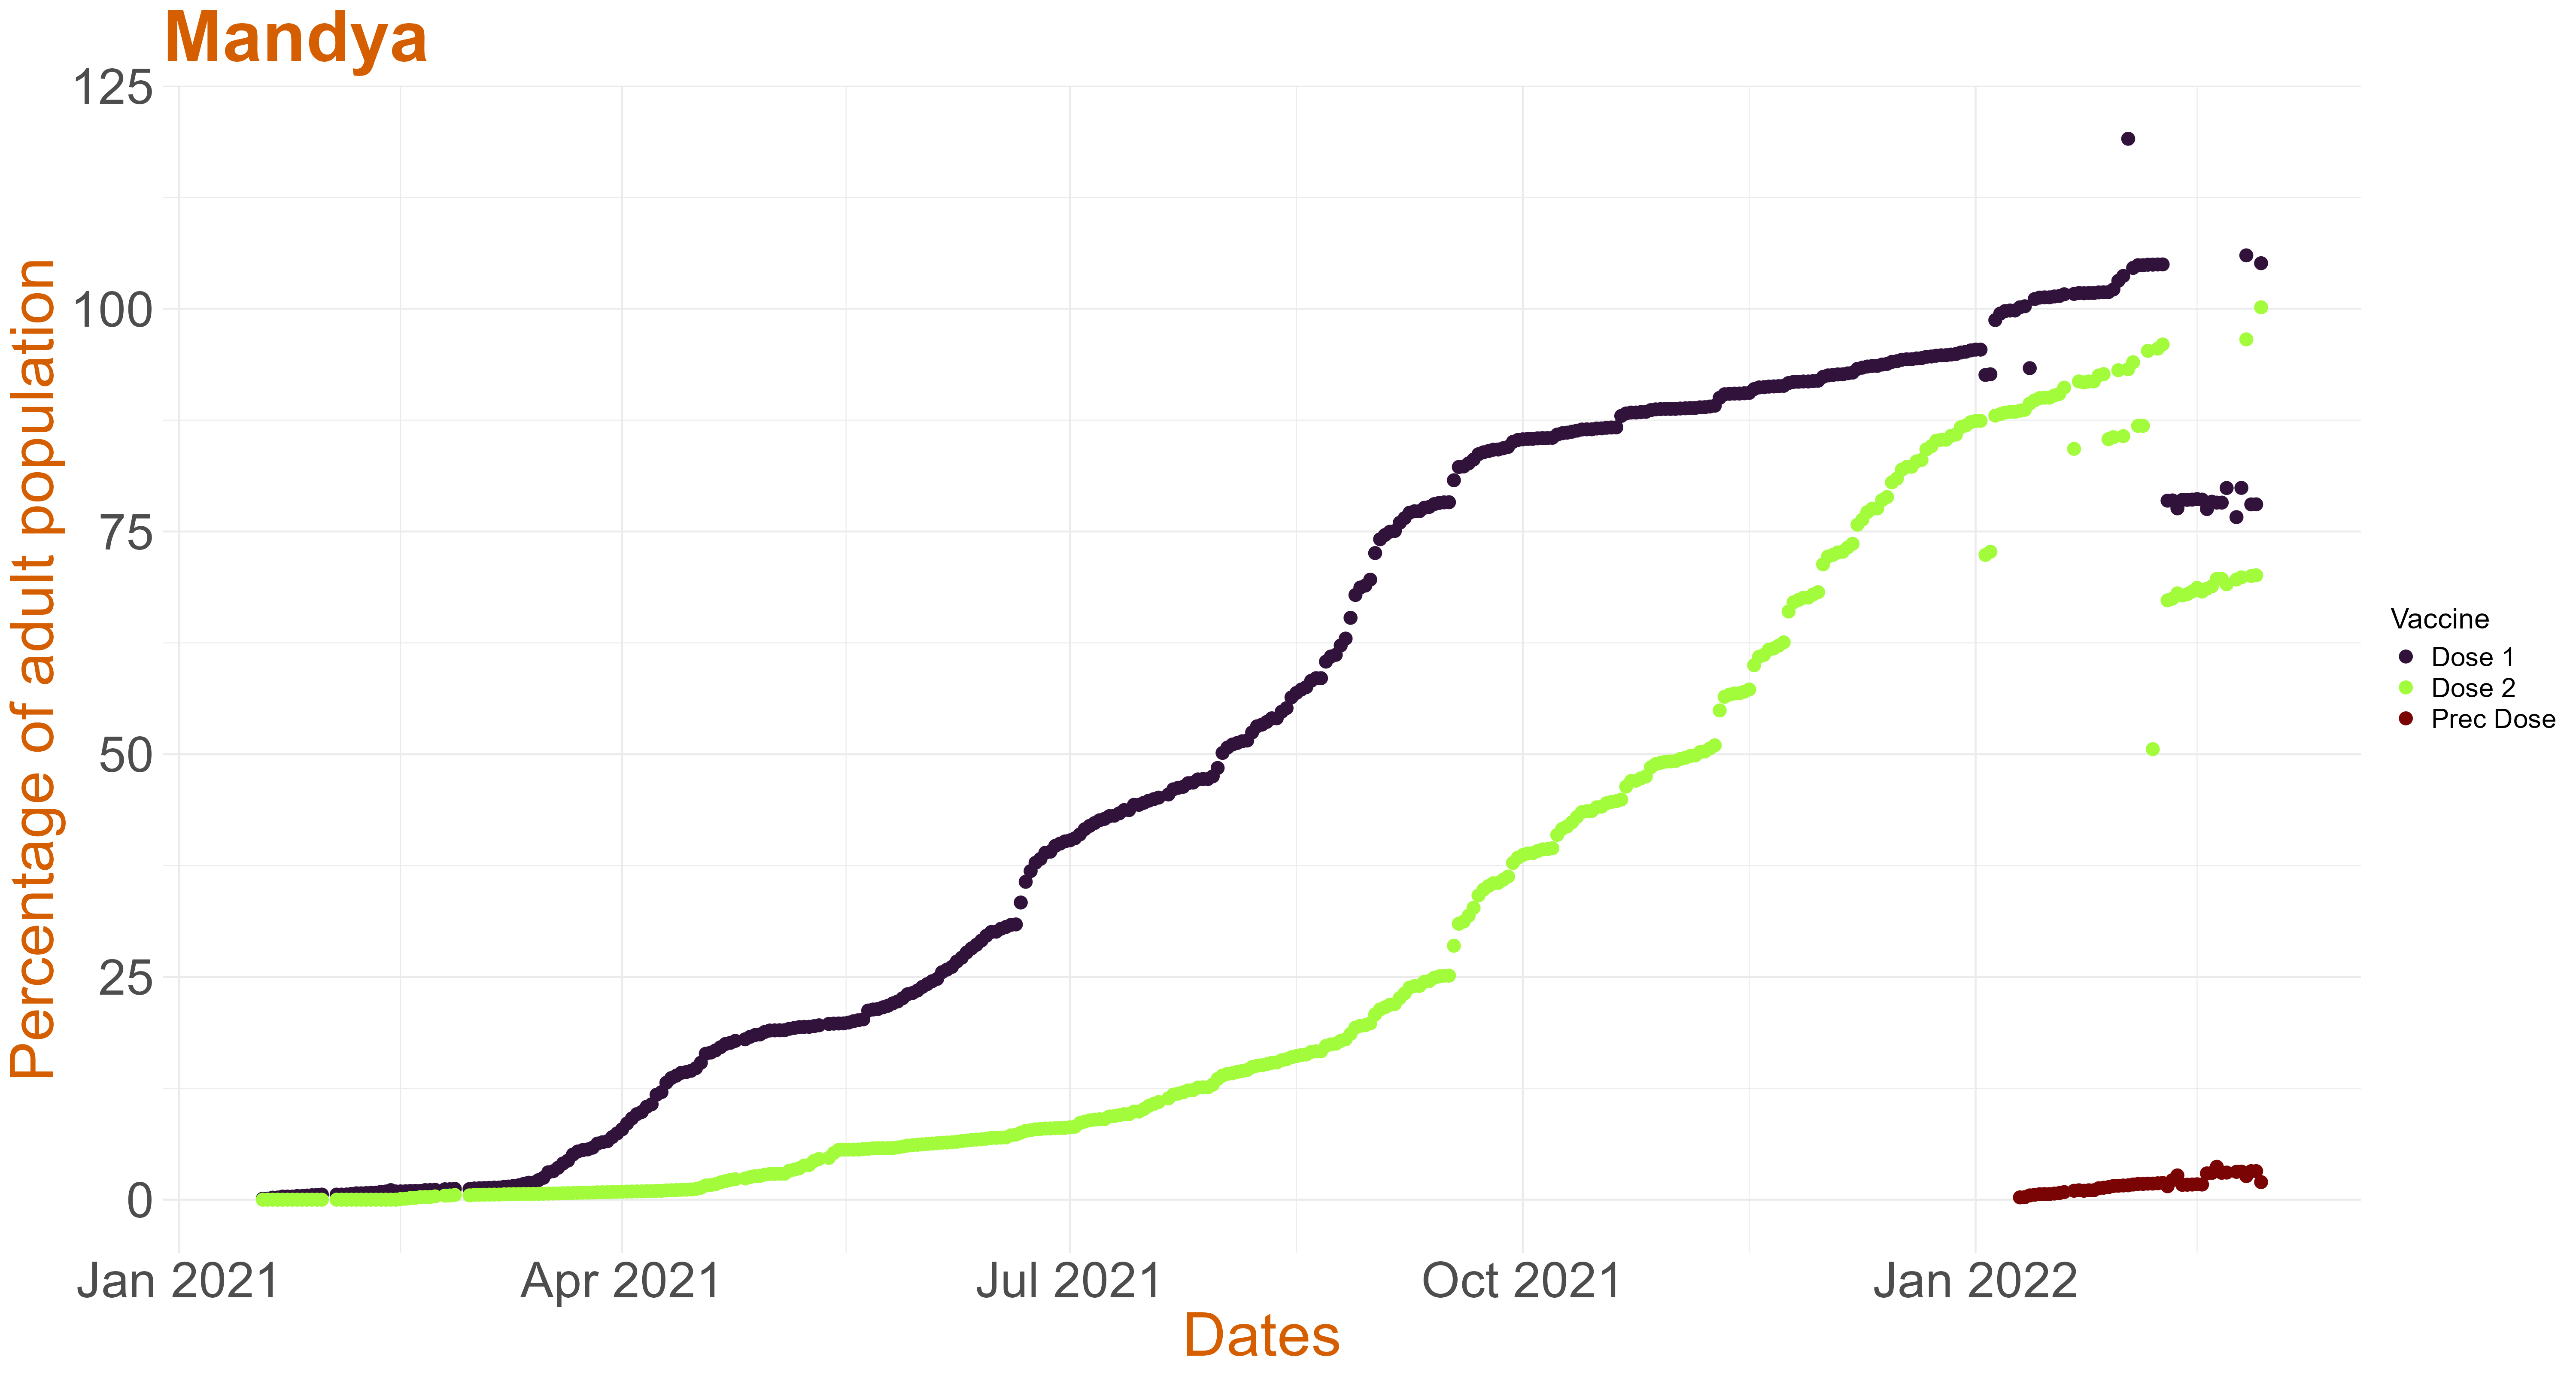
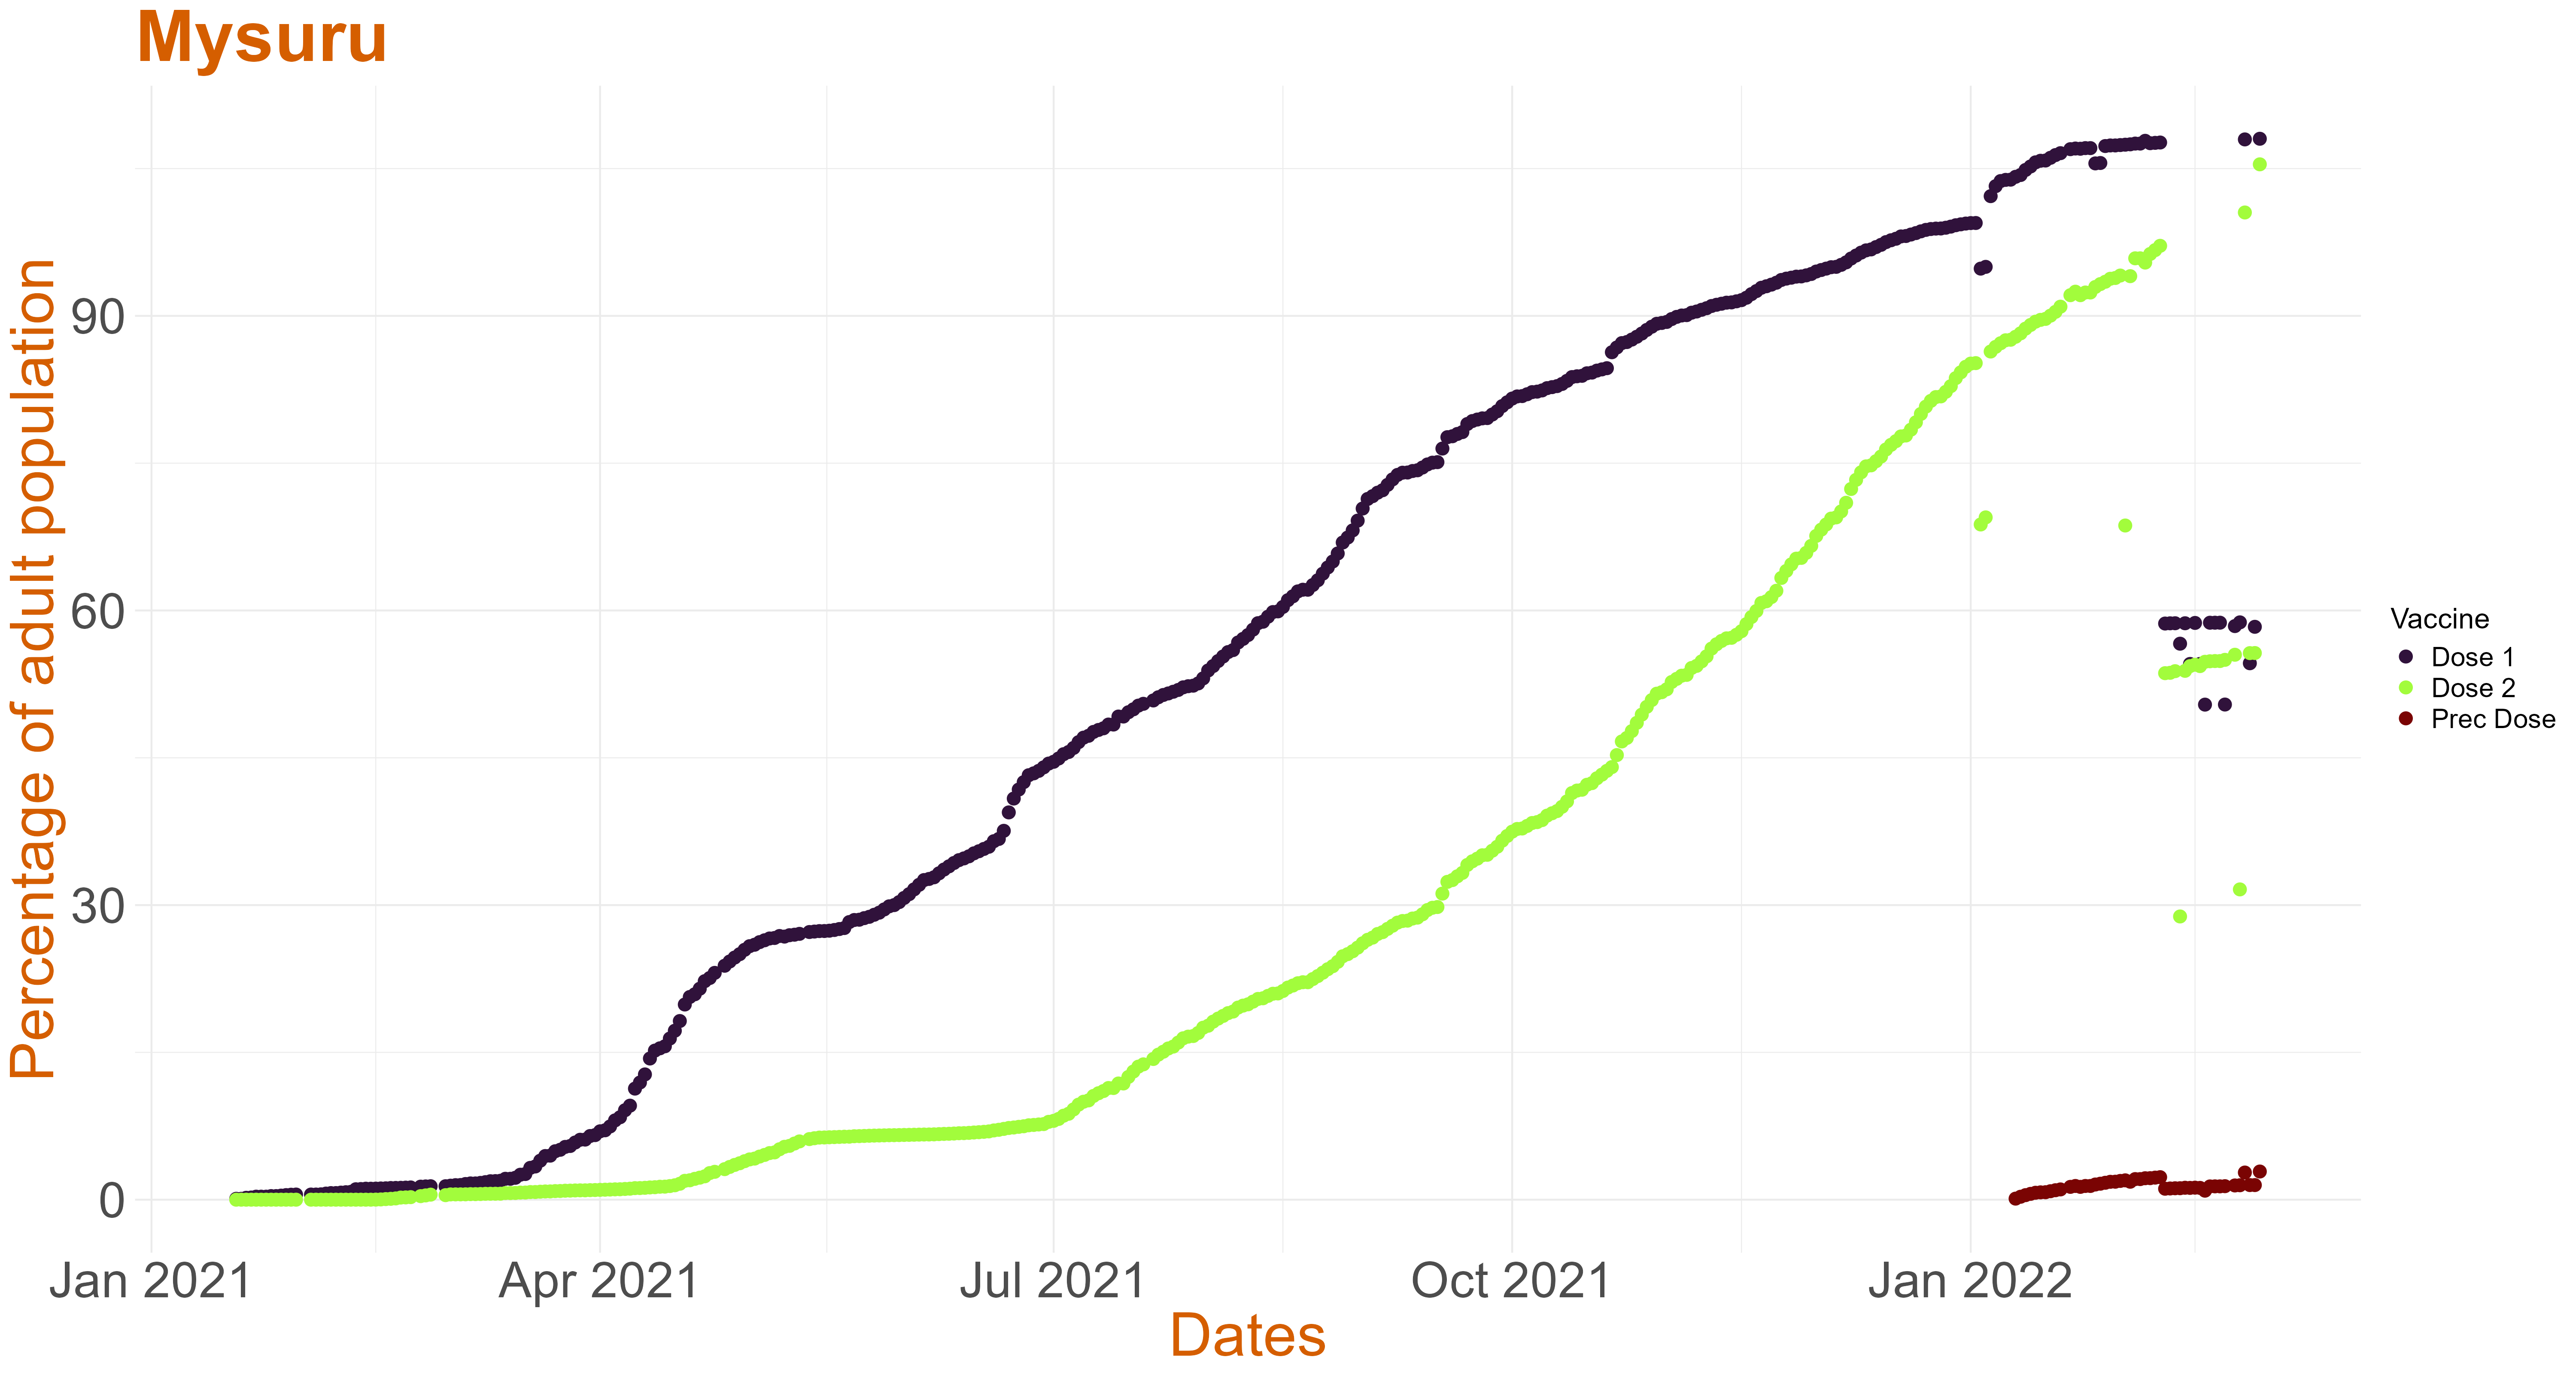
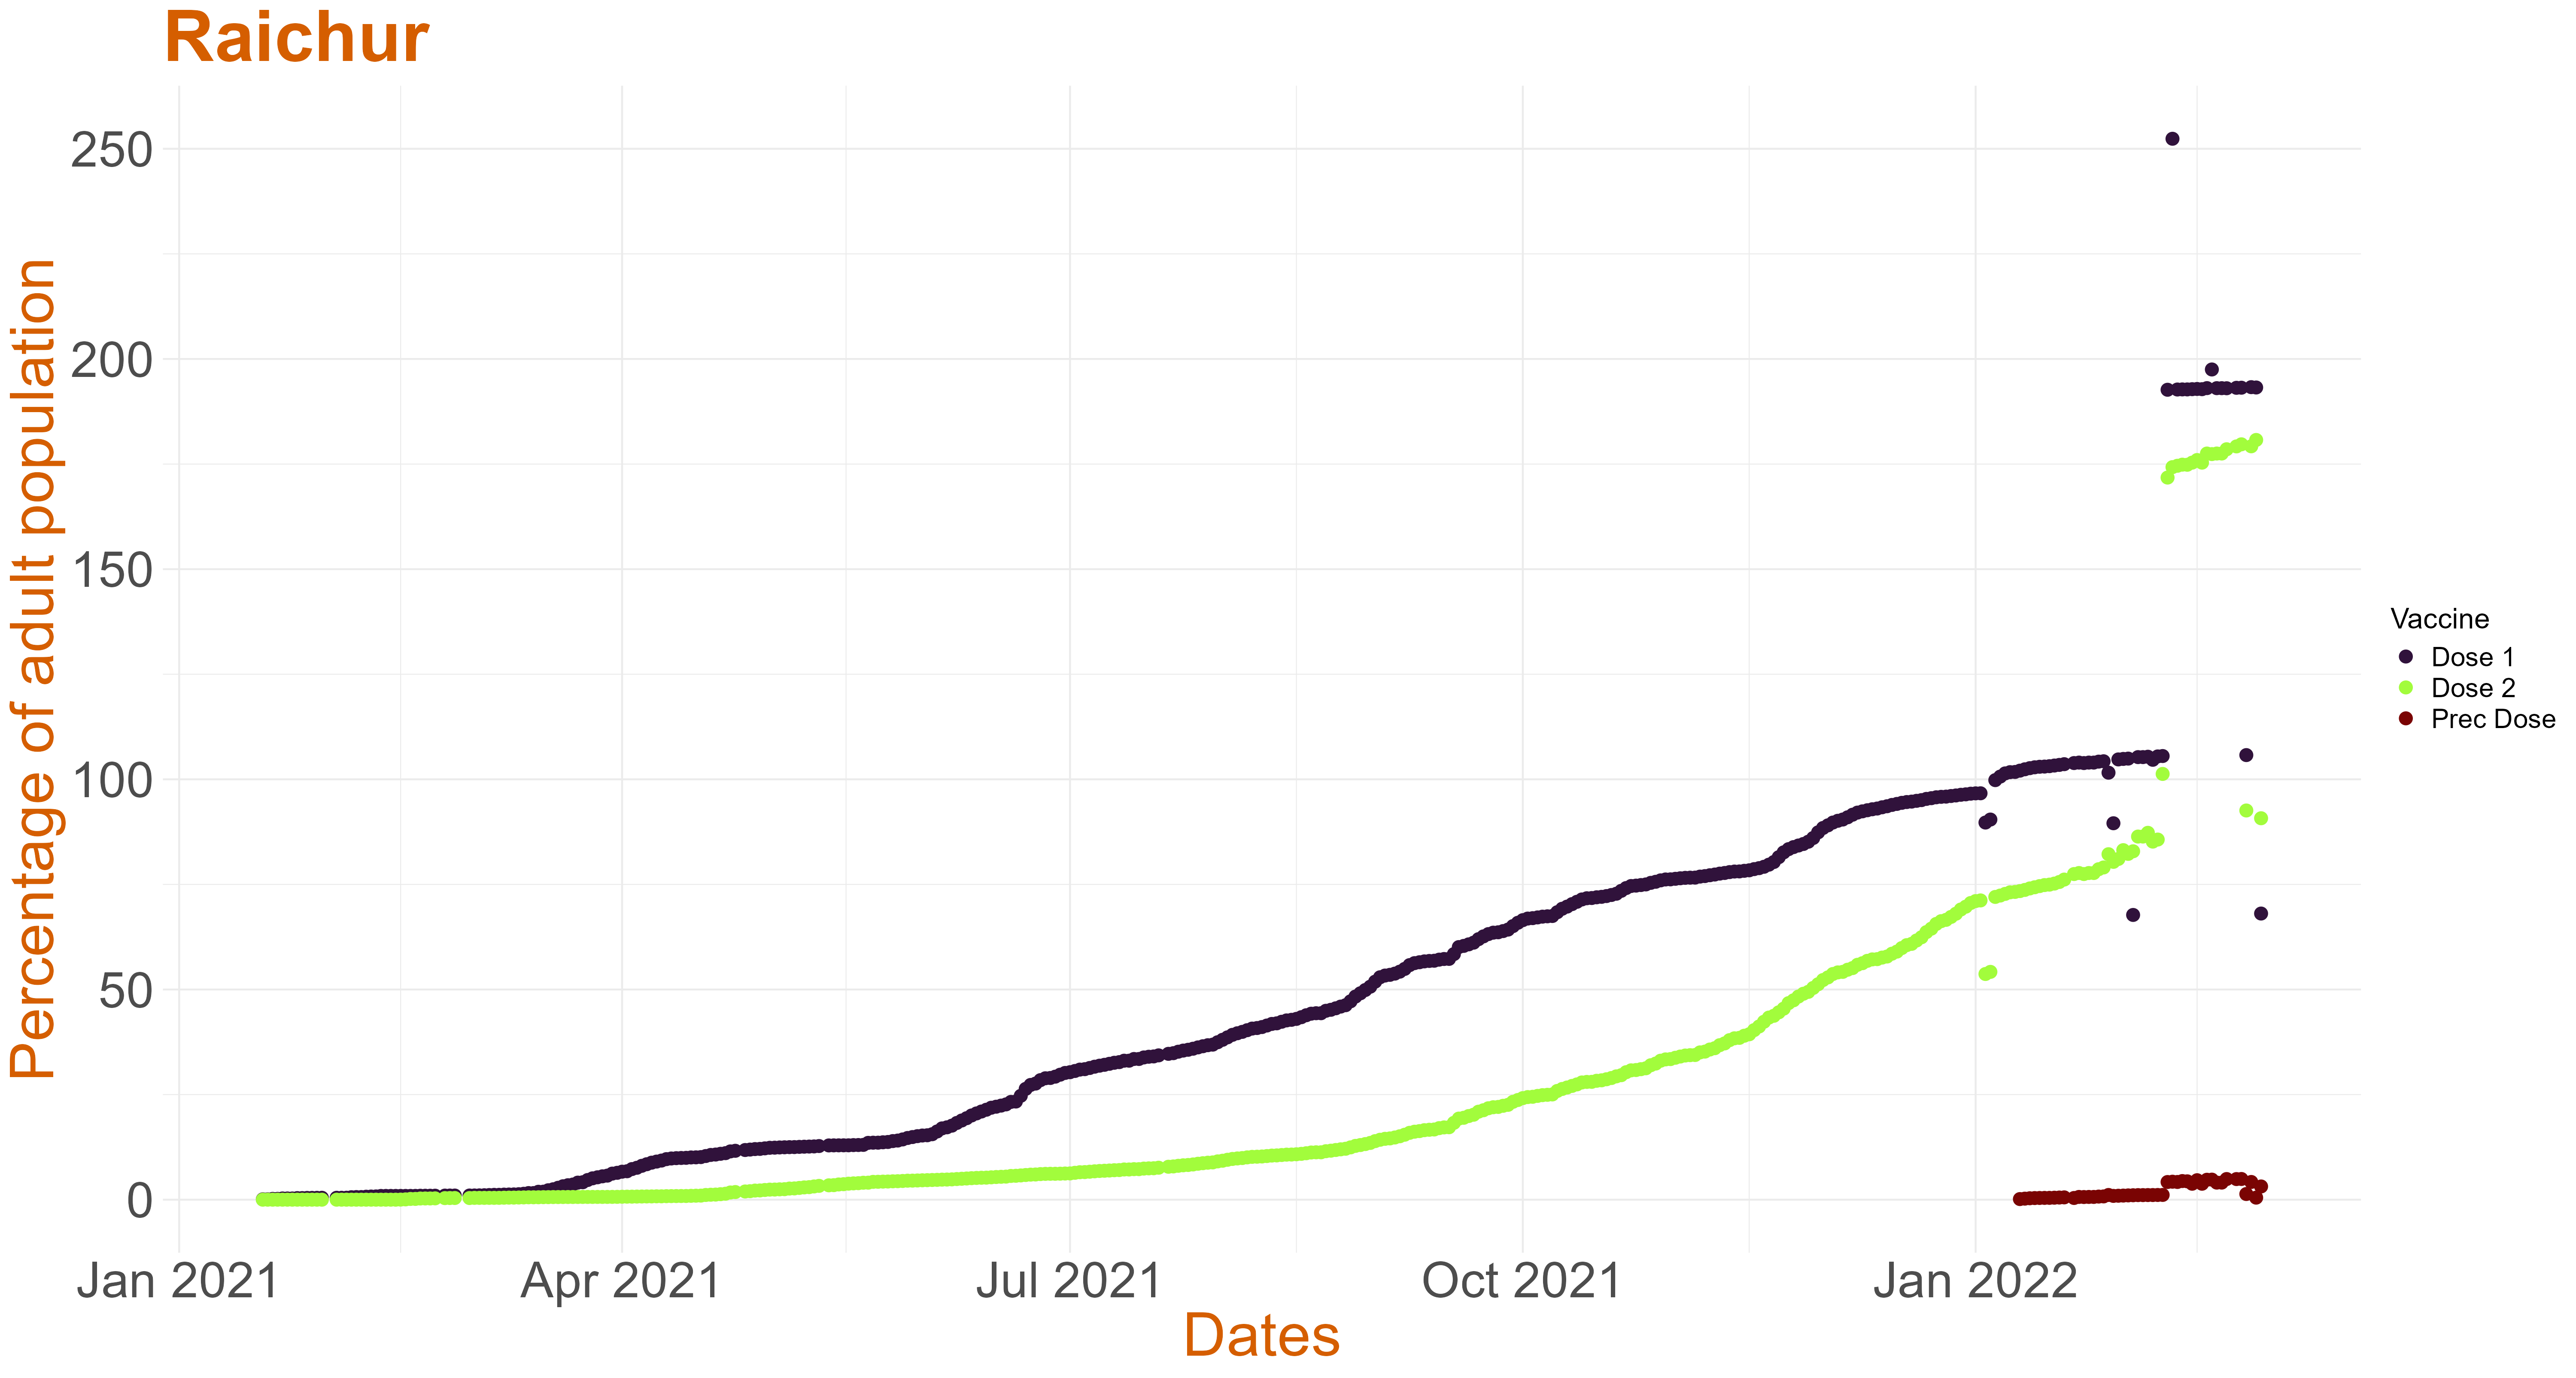
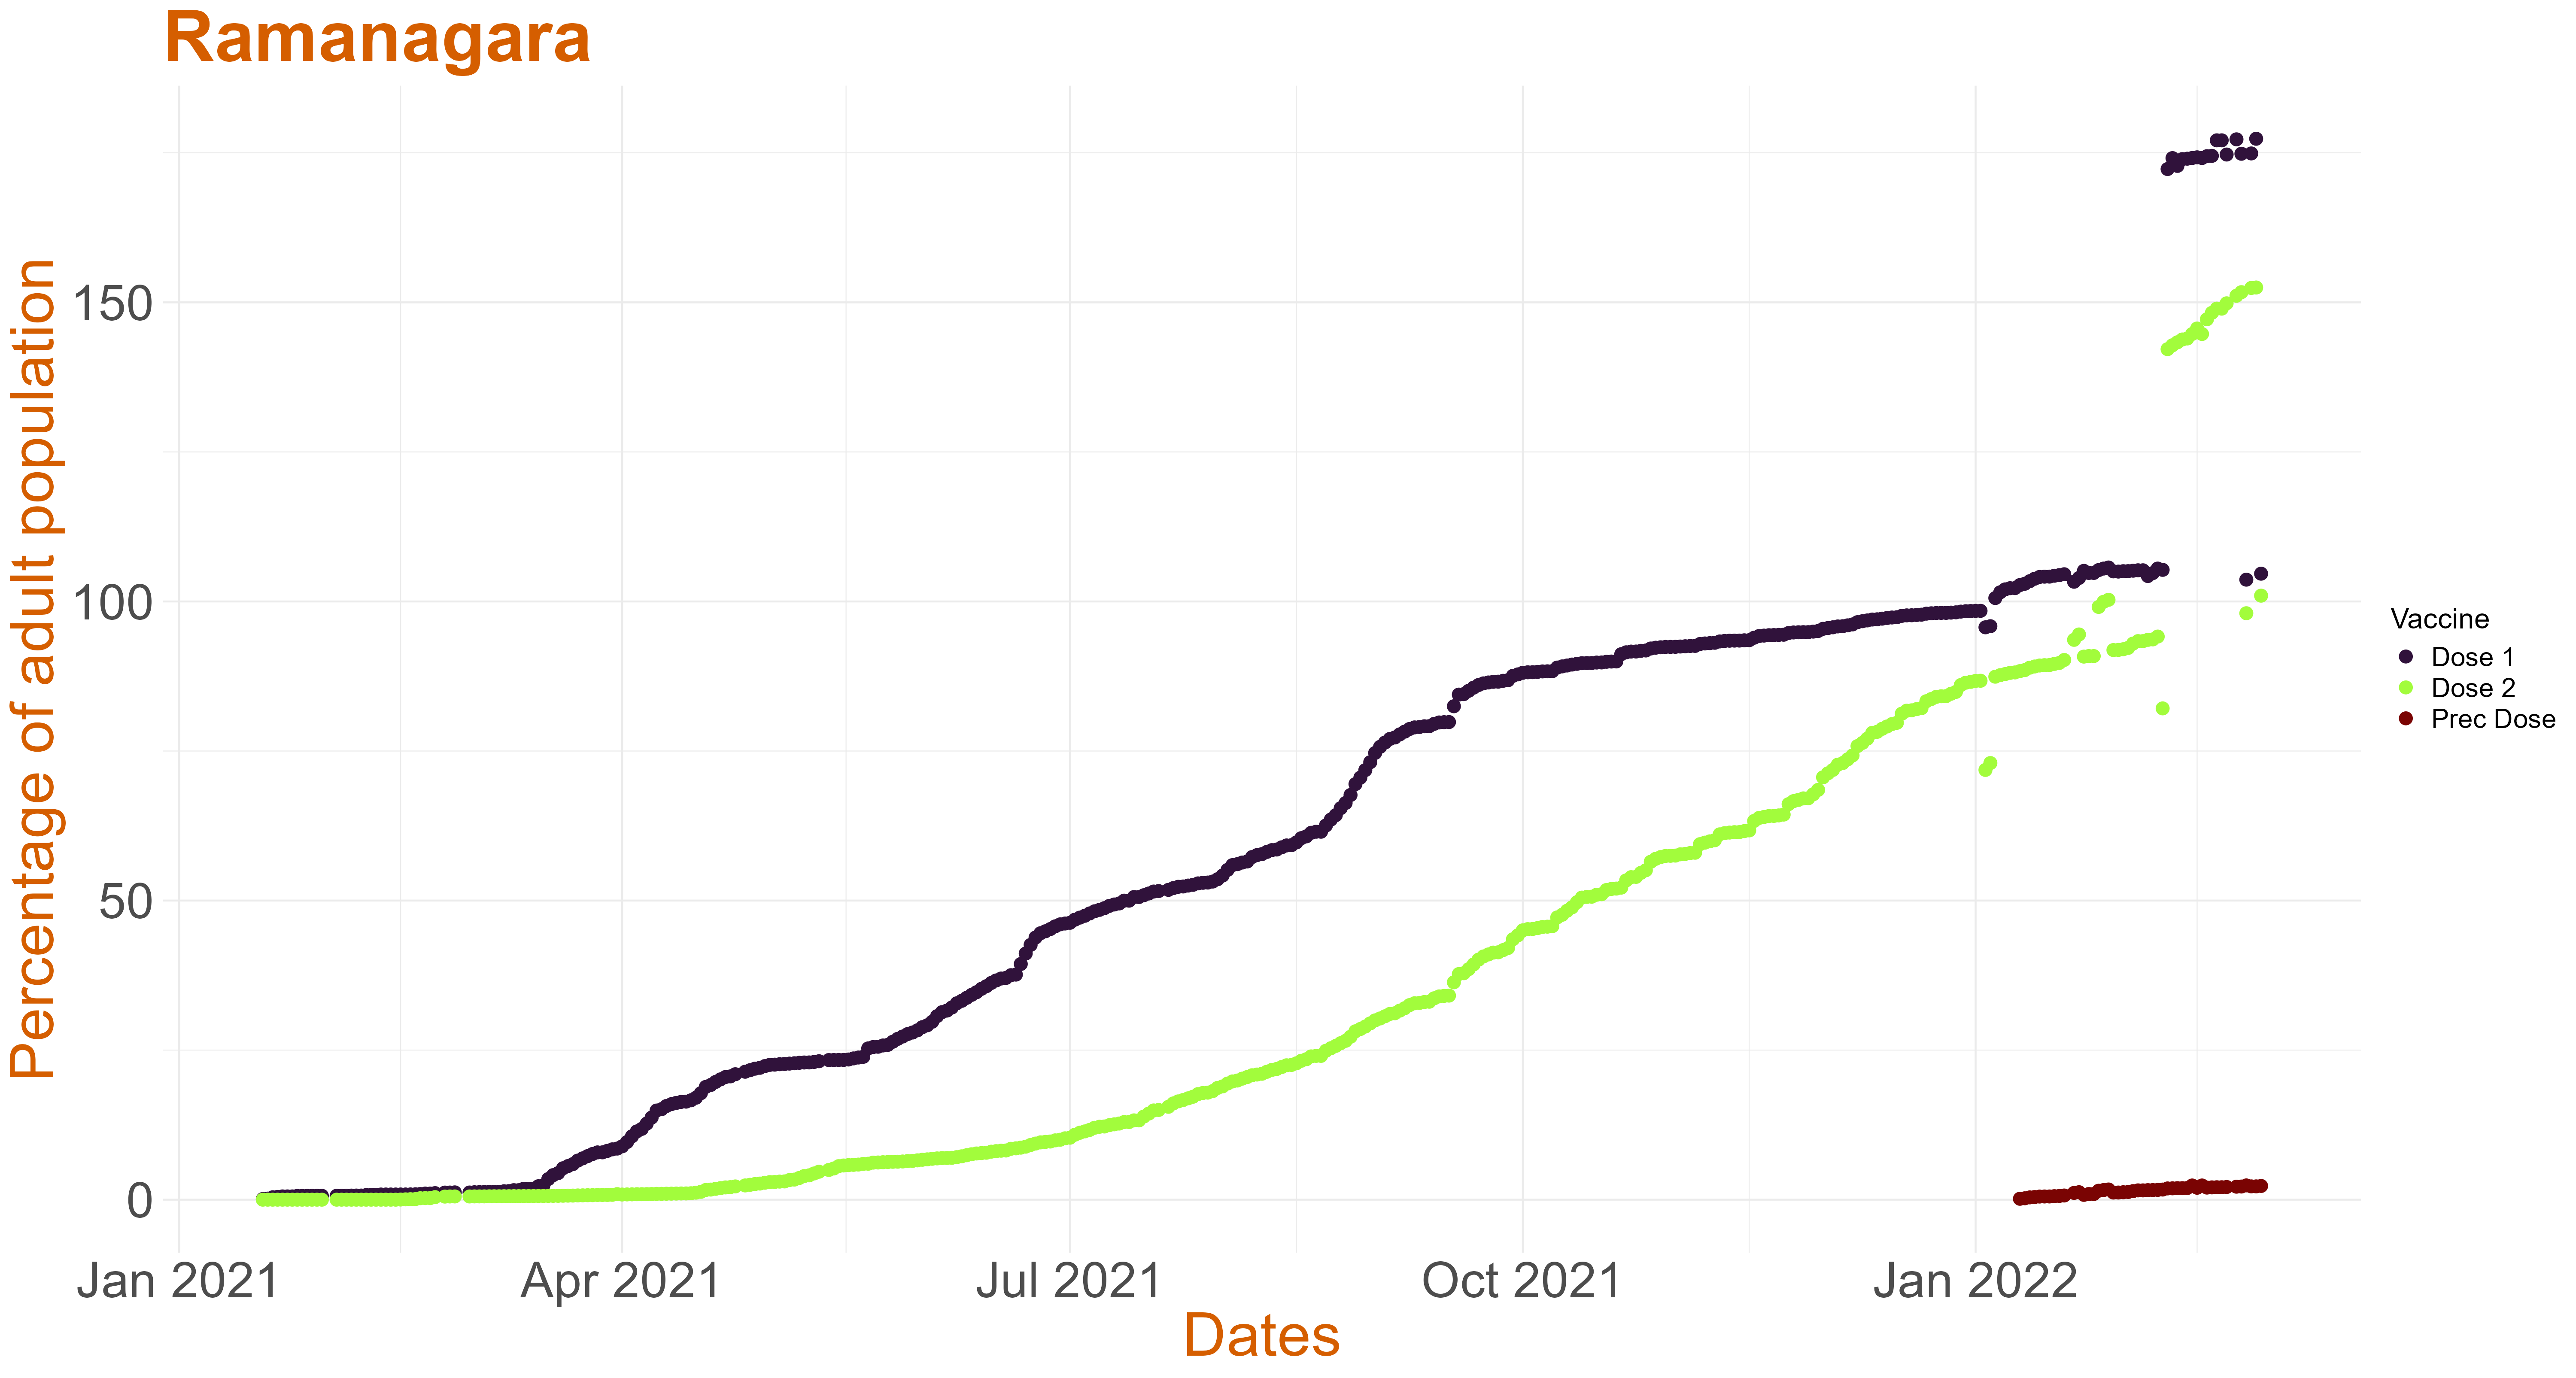
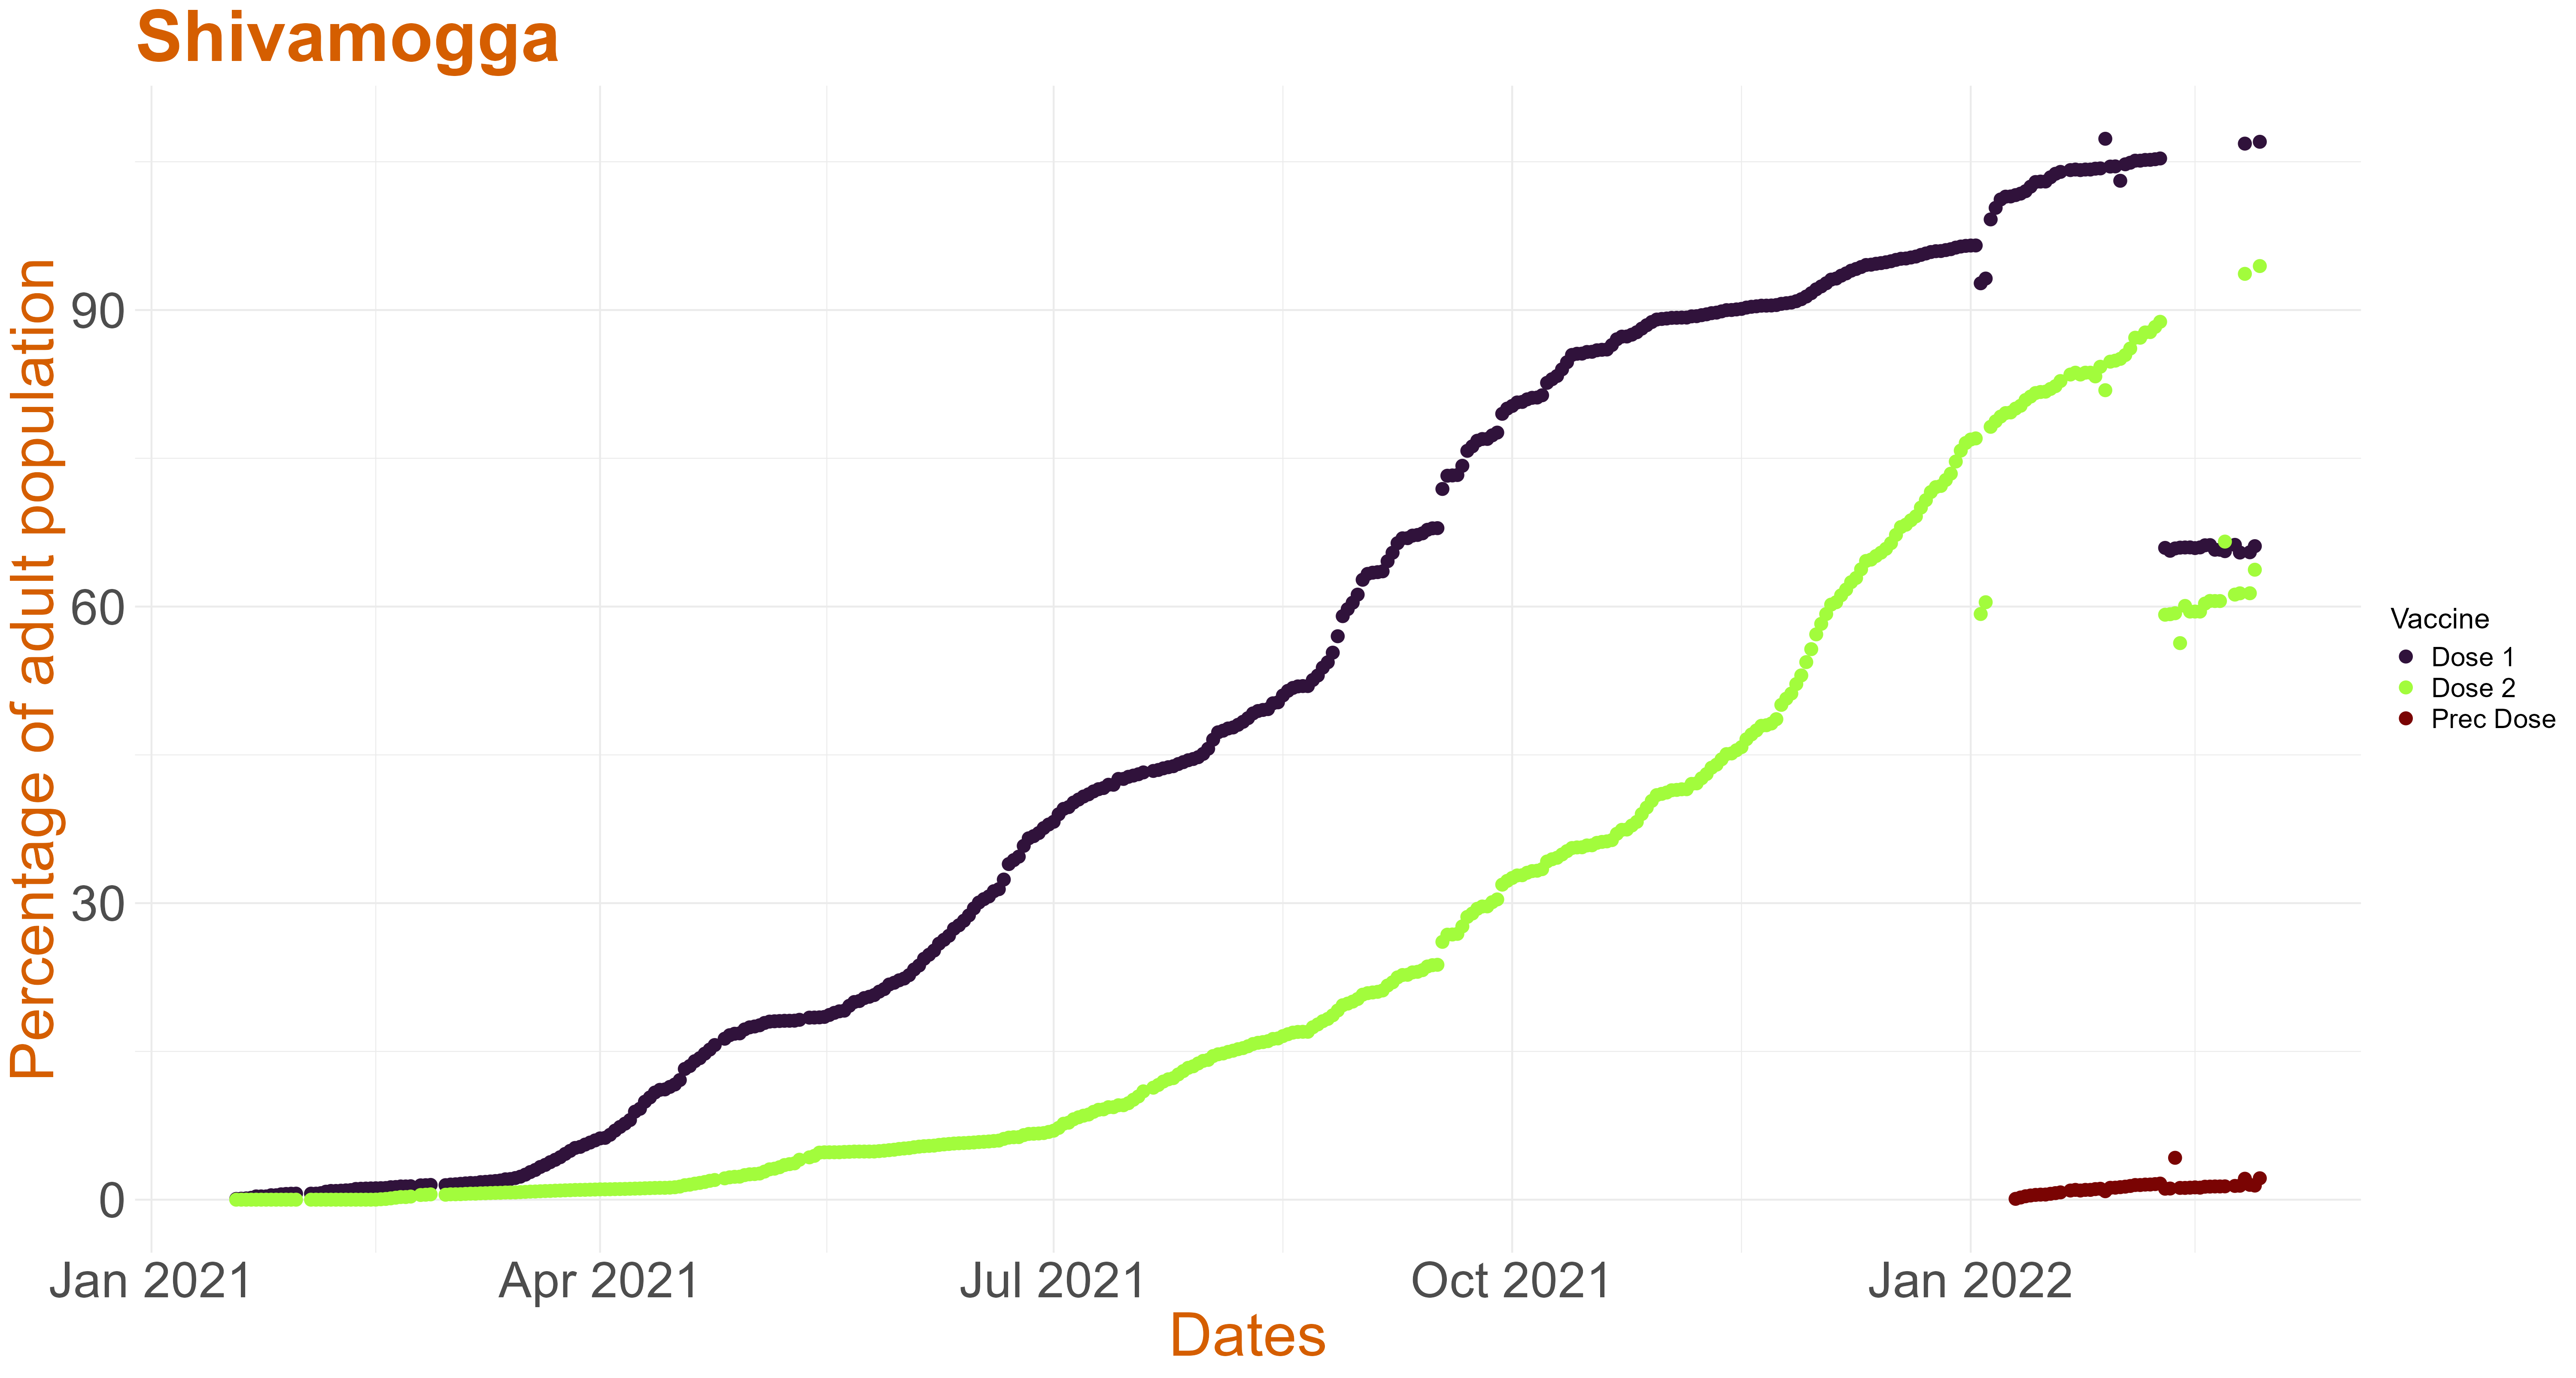
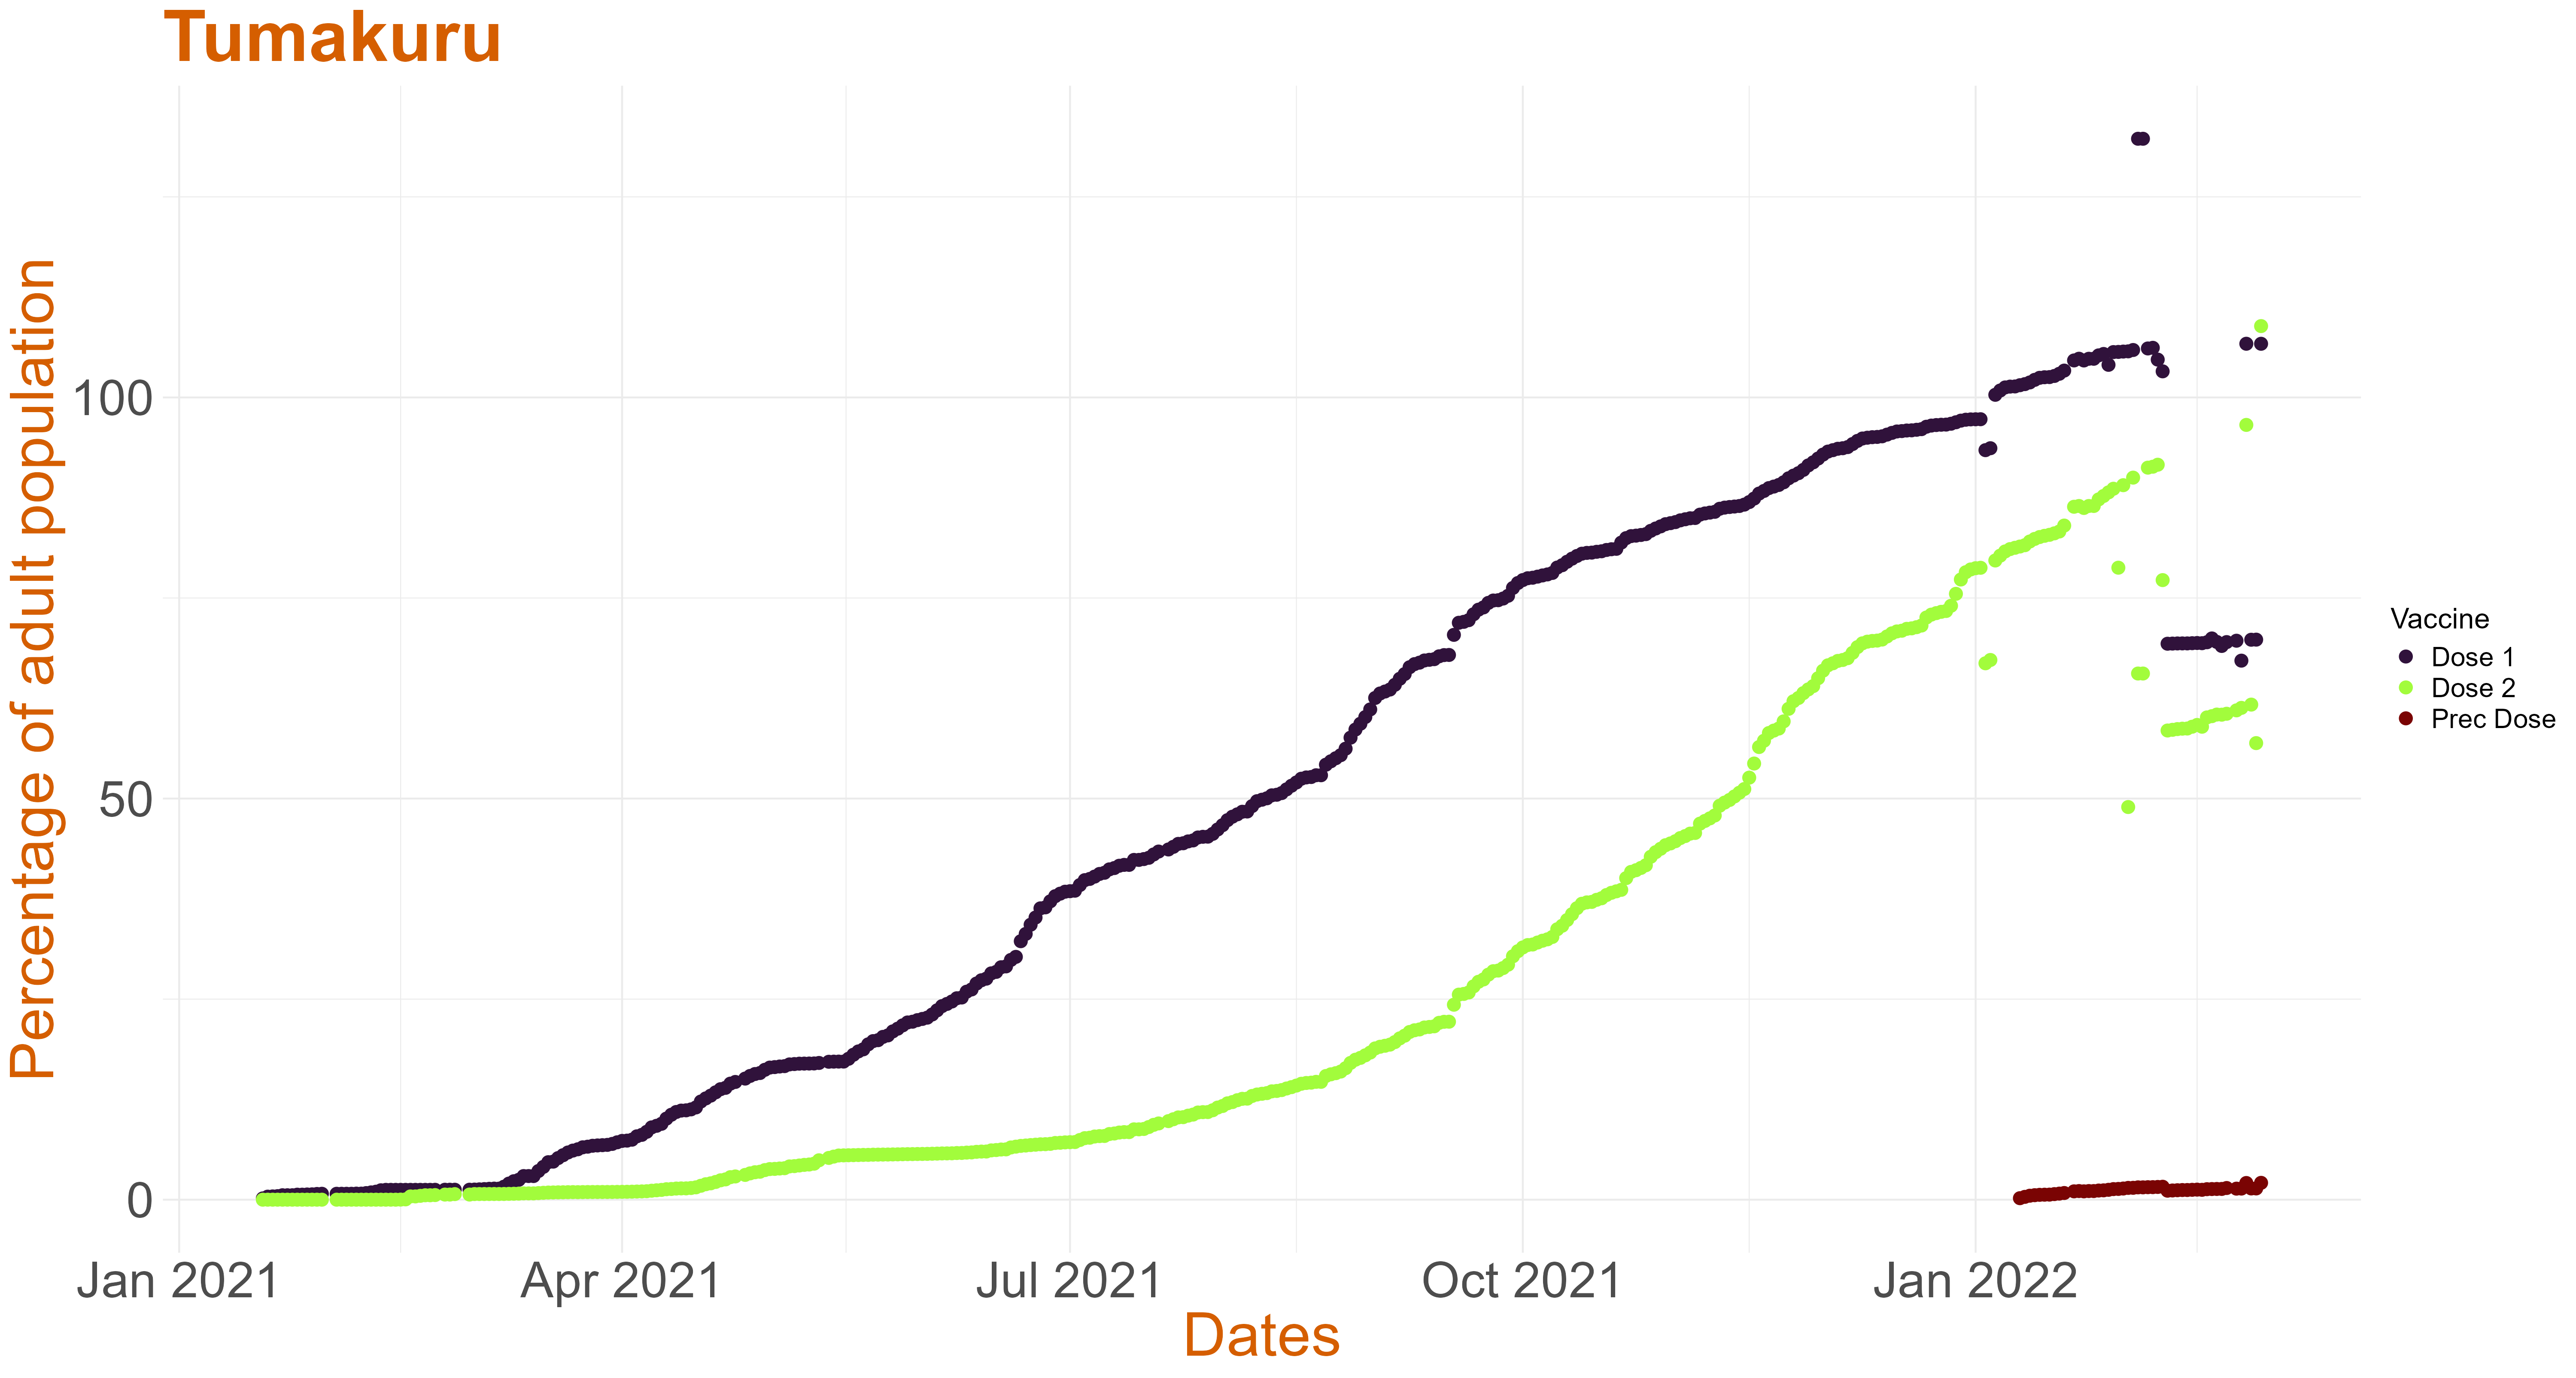
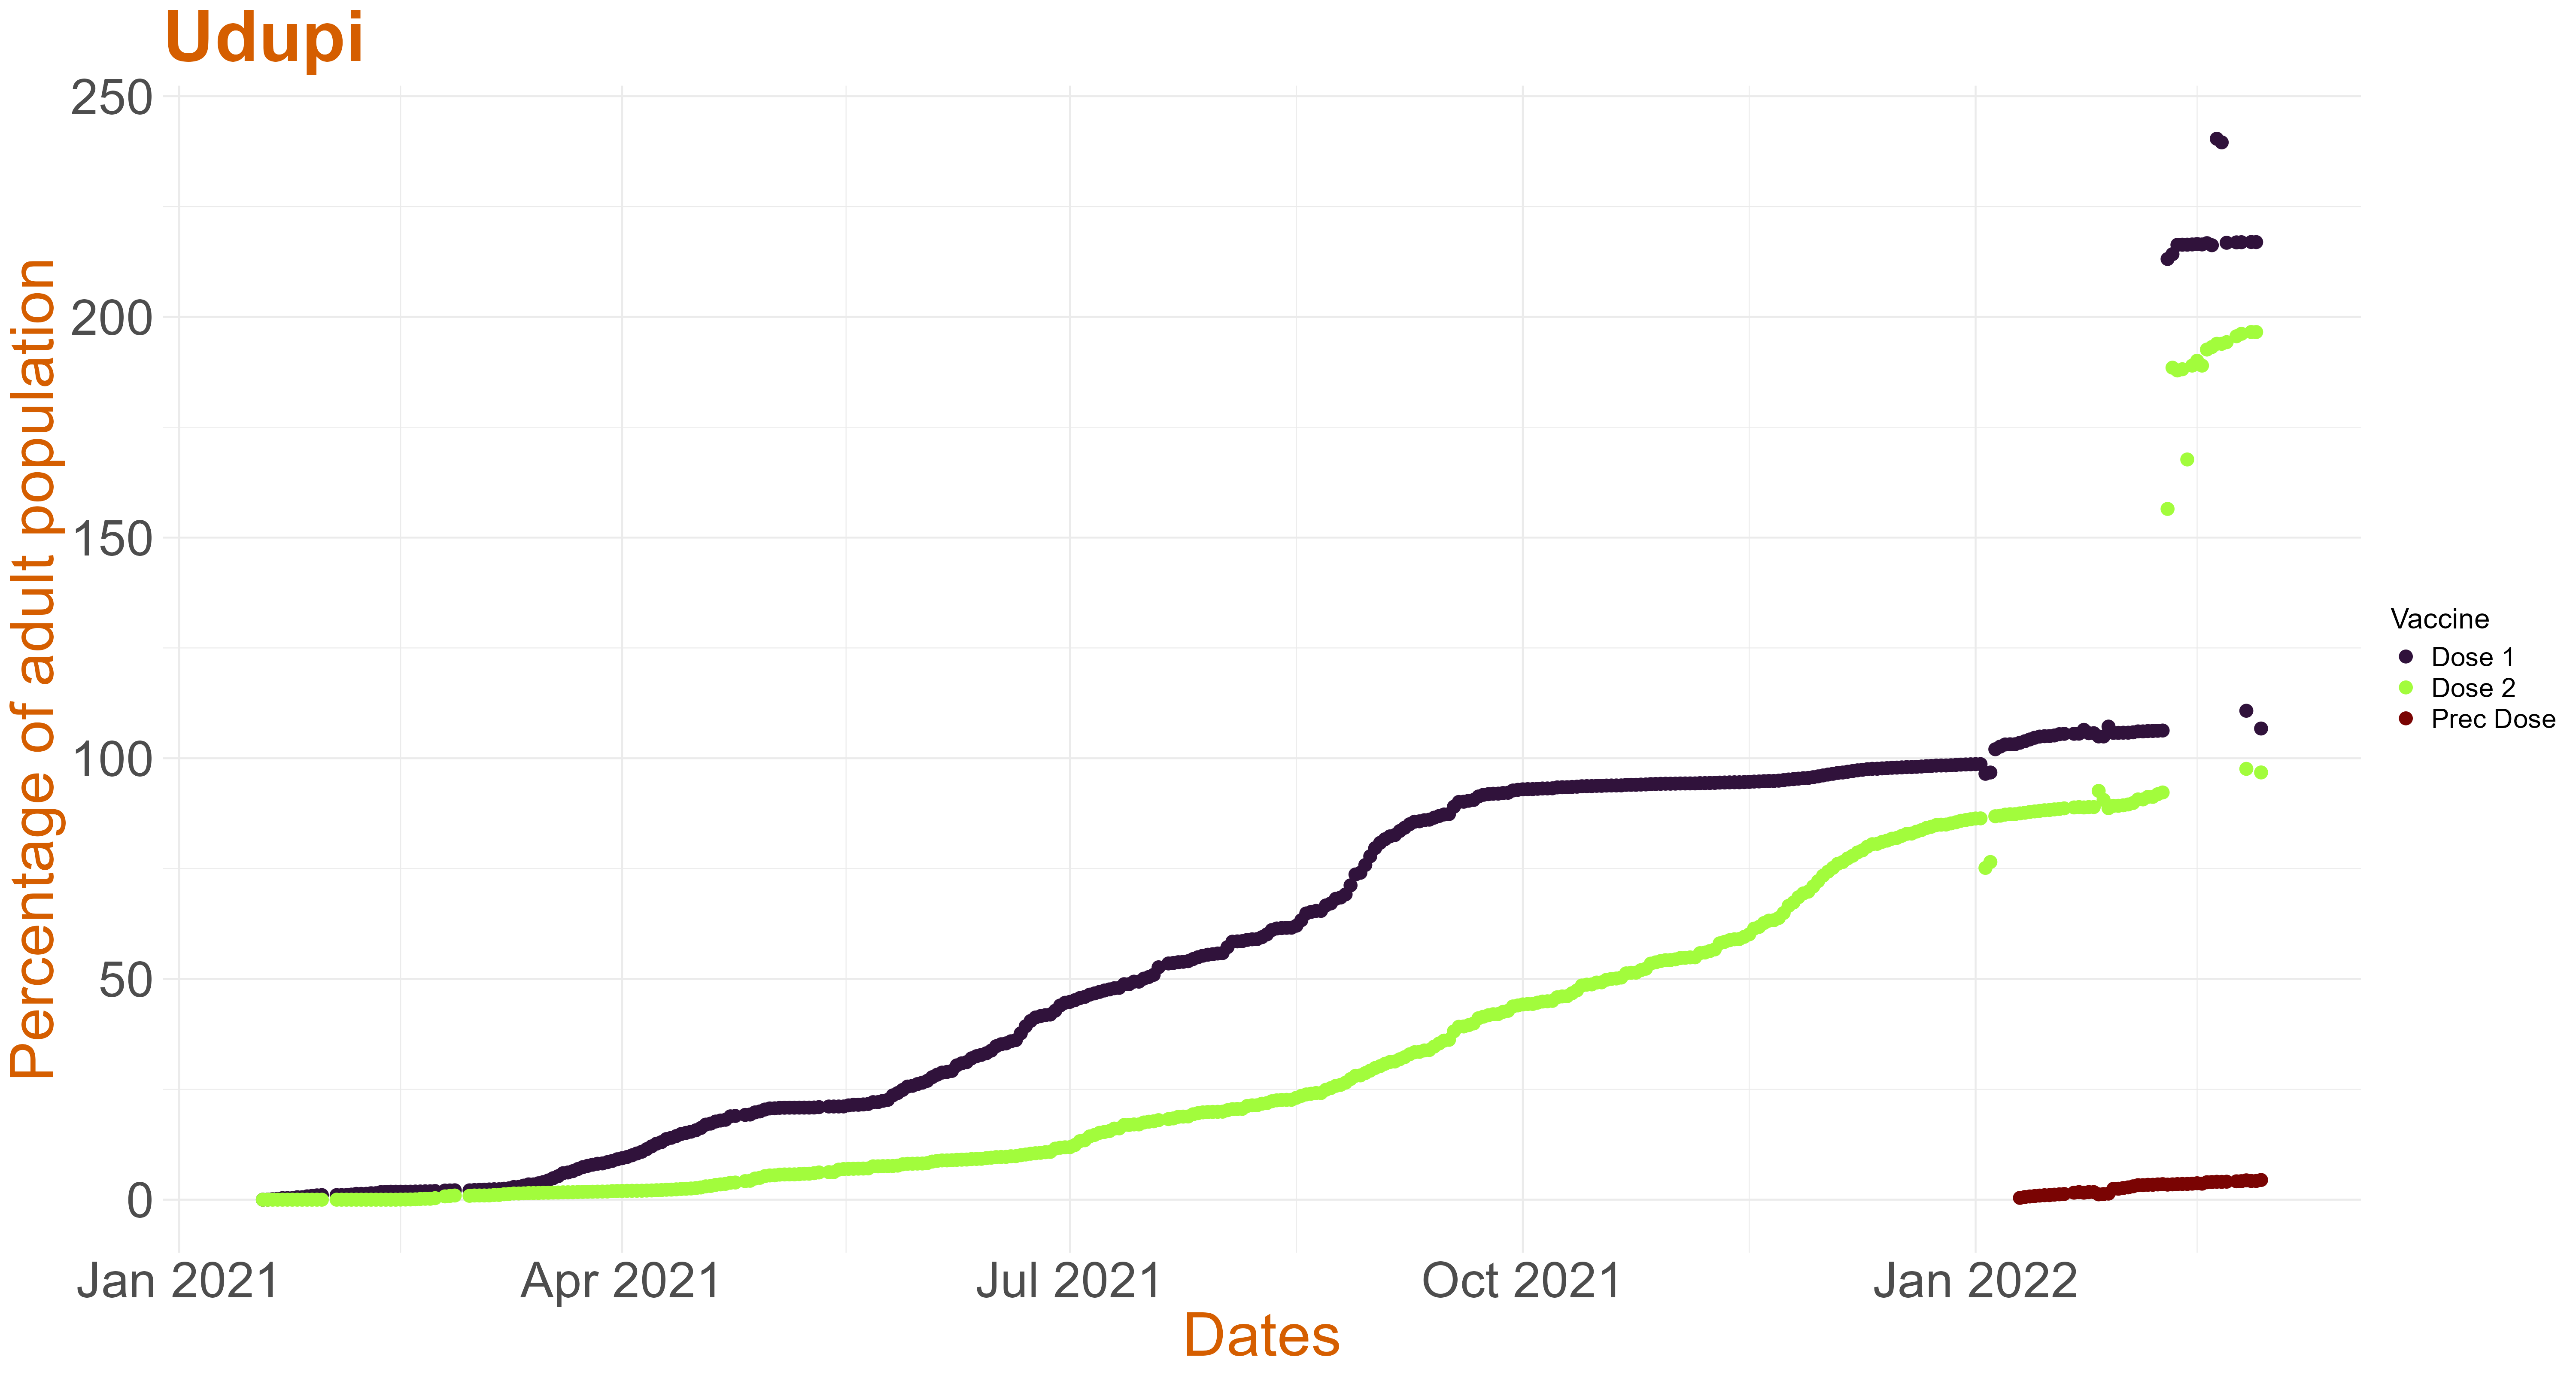
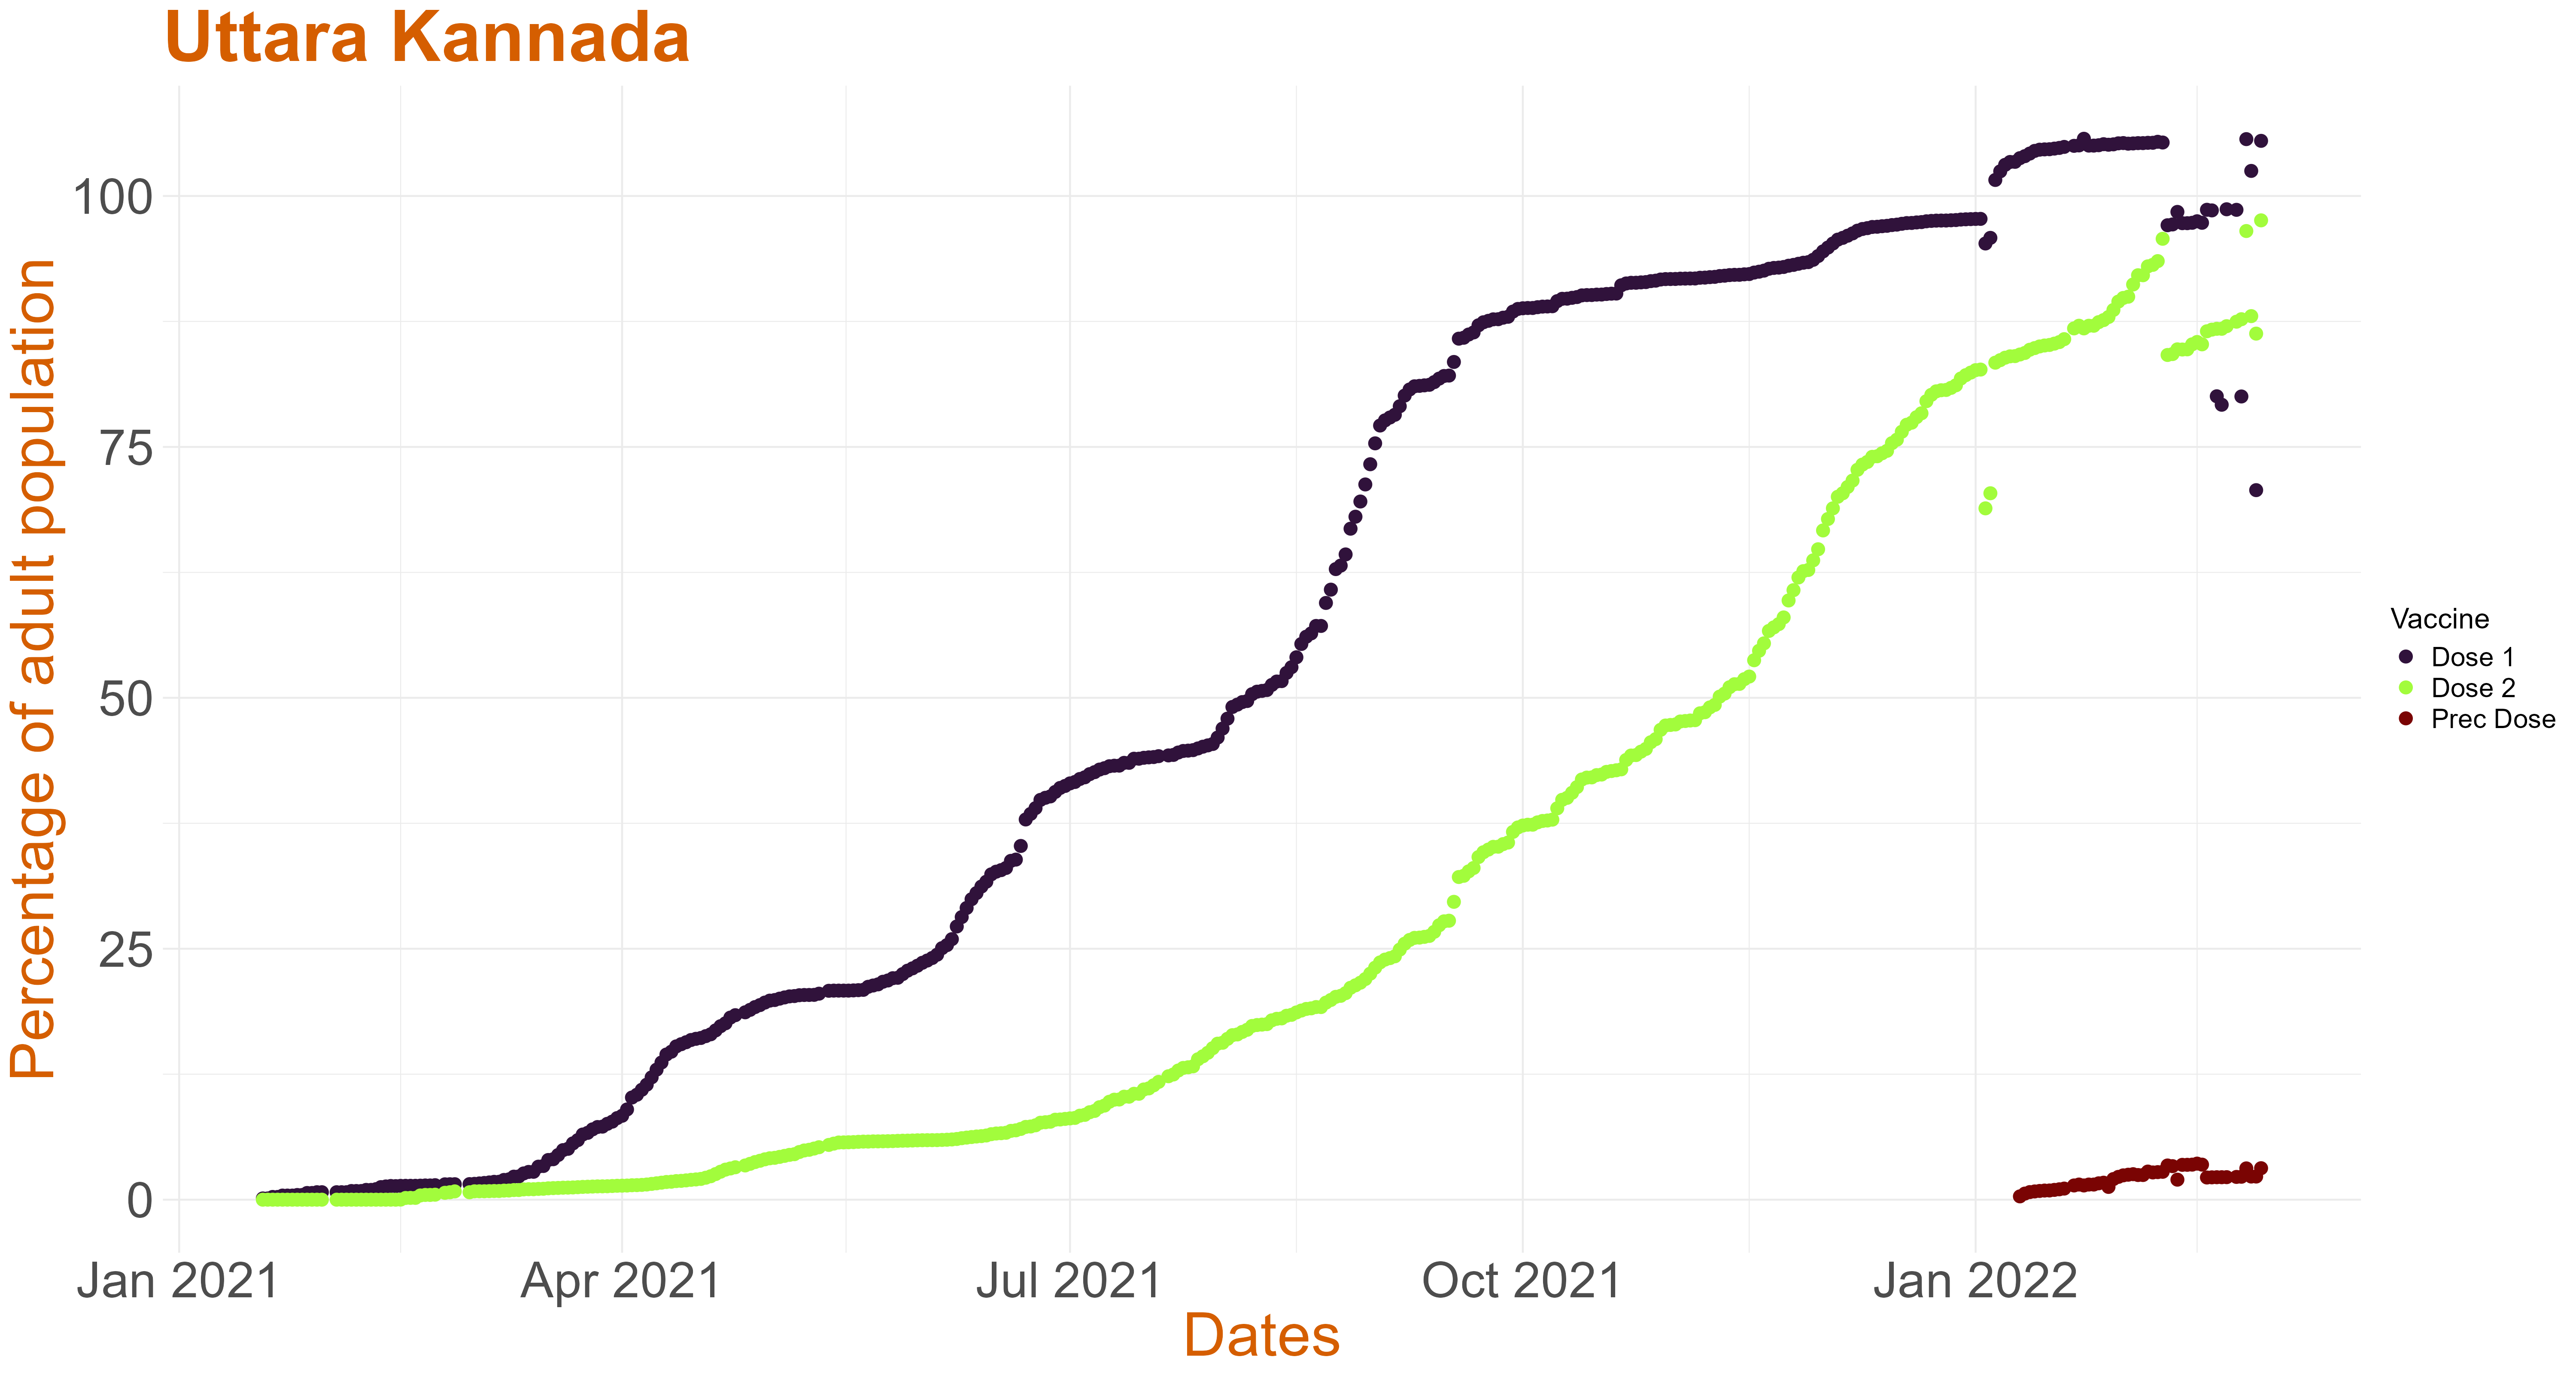
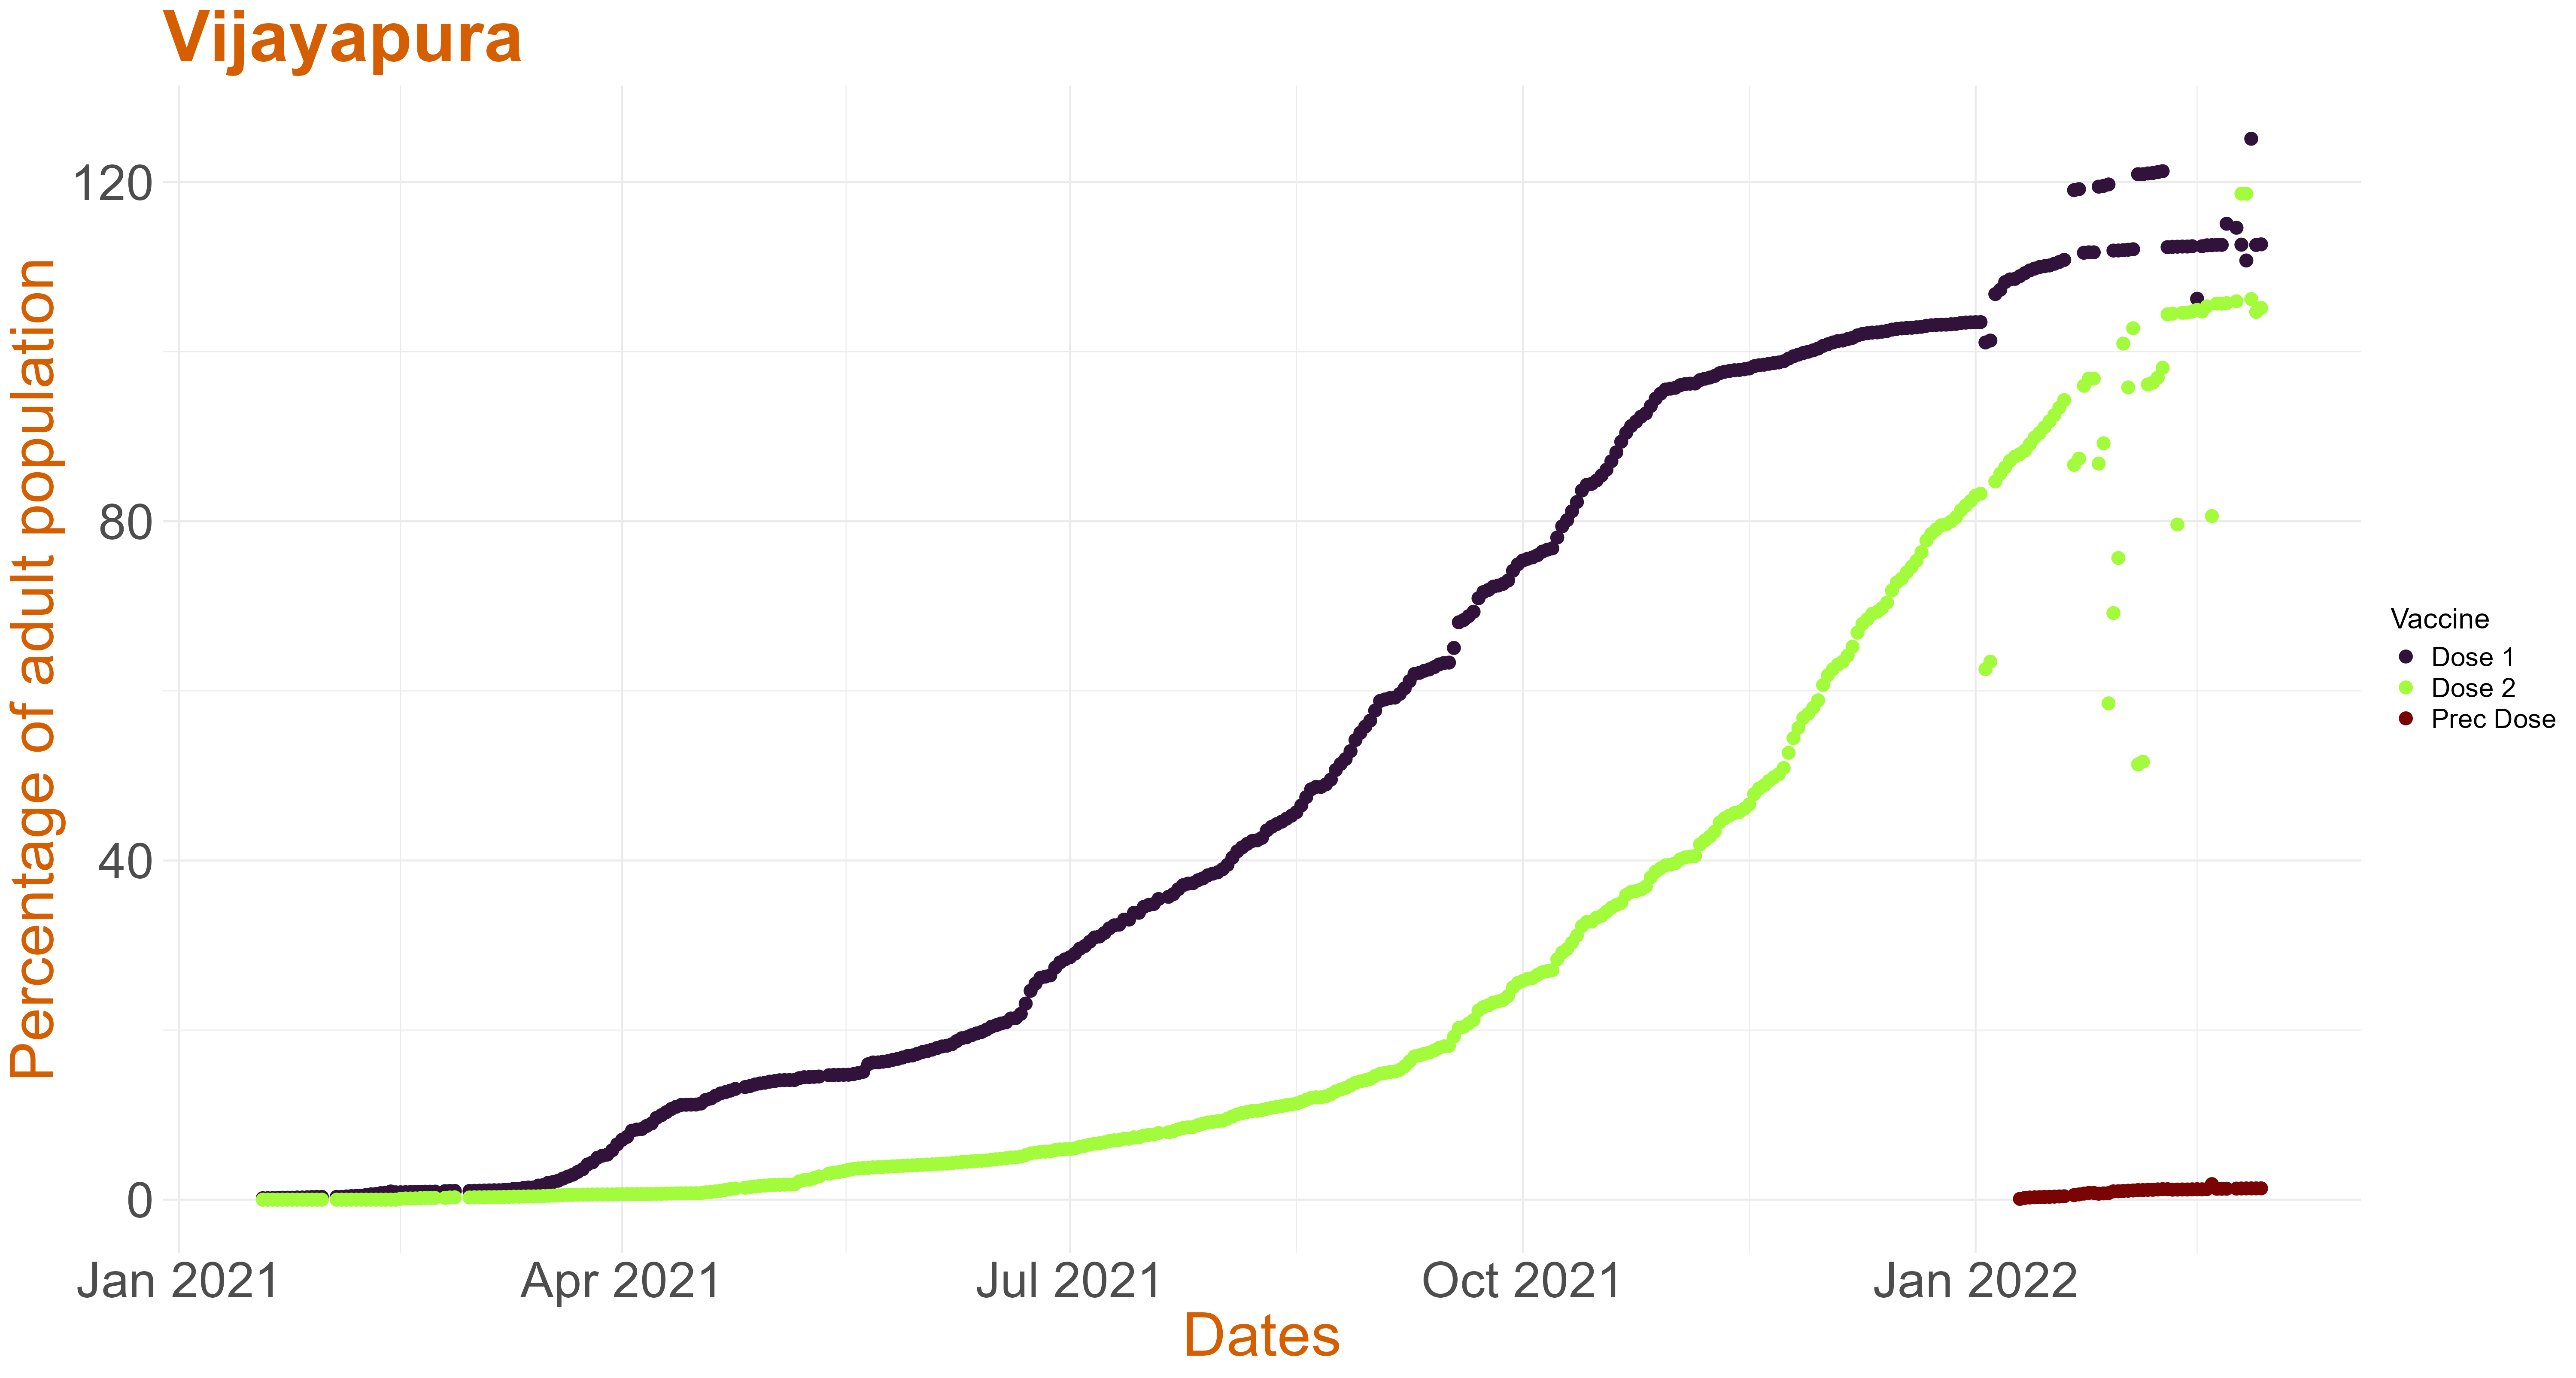
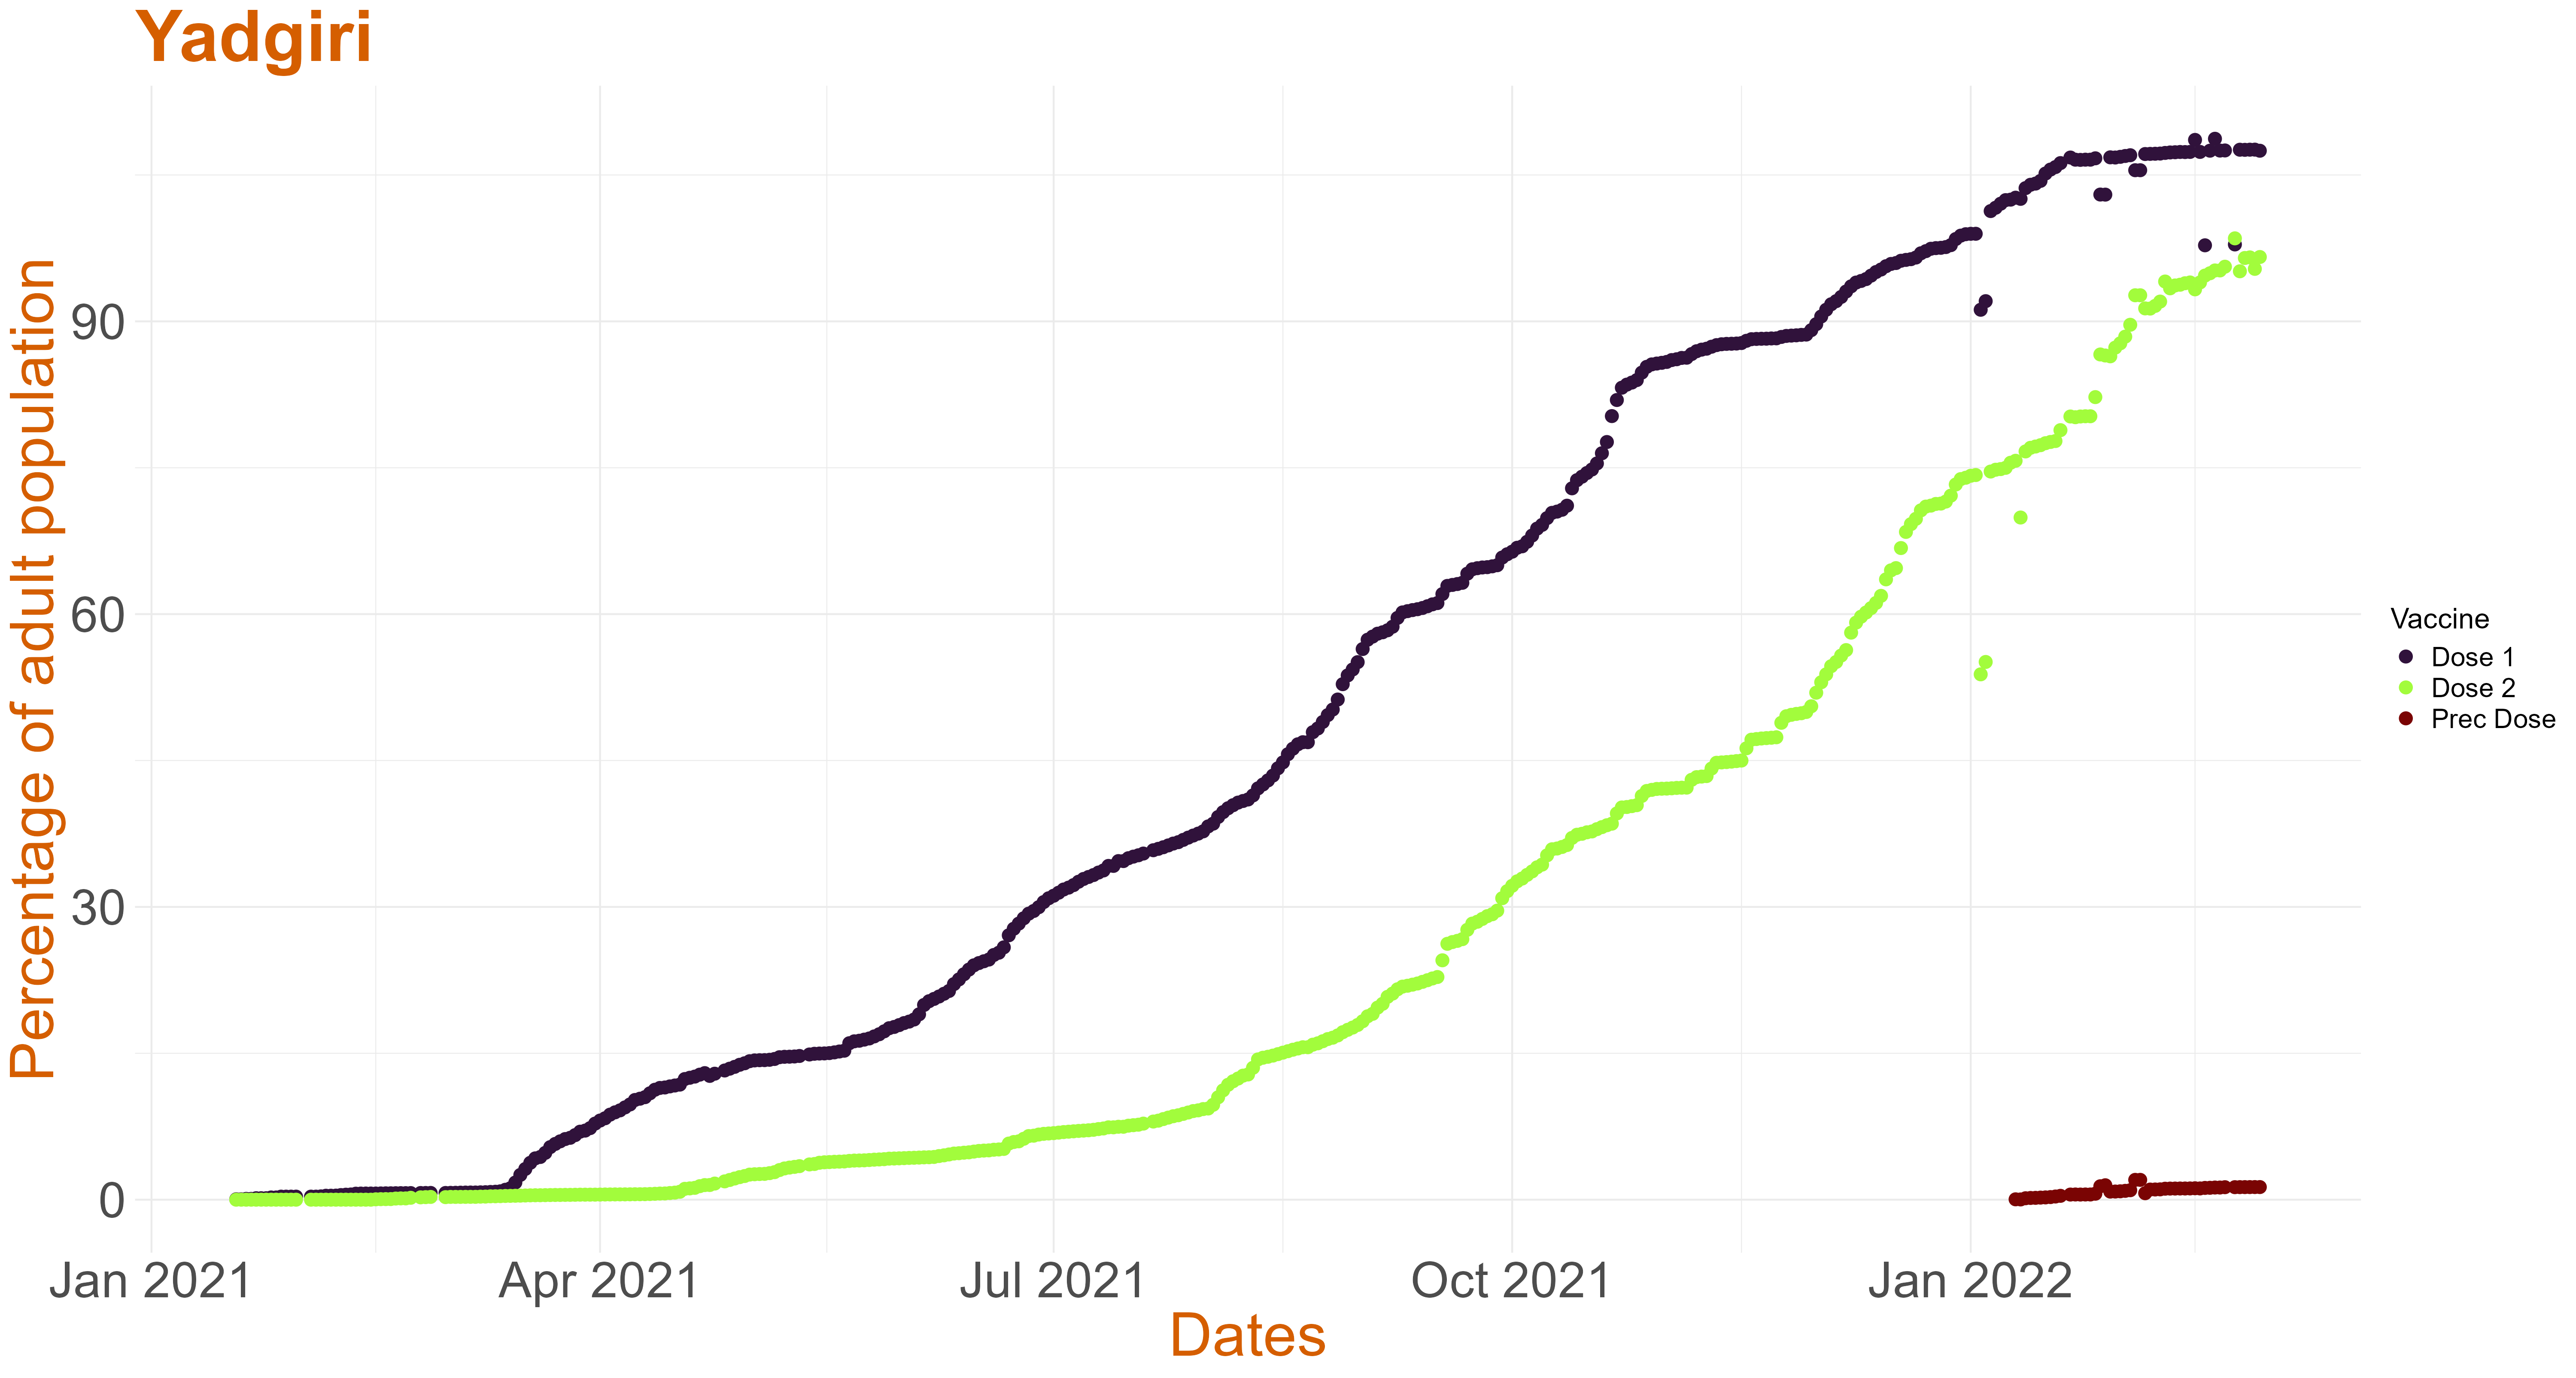
All the graphs below provide the cumulative dose 1, dose 2 and precaution dose vaccination percentage for each district.
All the graphs below provide the cumulative dose 1, dose 2 and precaution dose vaccination percentage for each district.