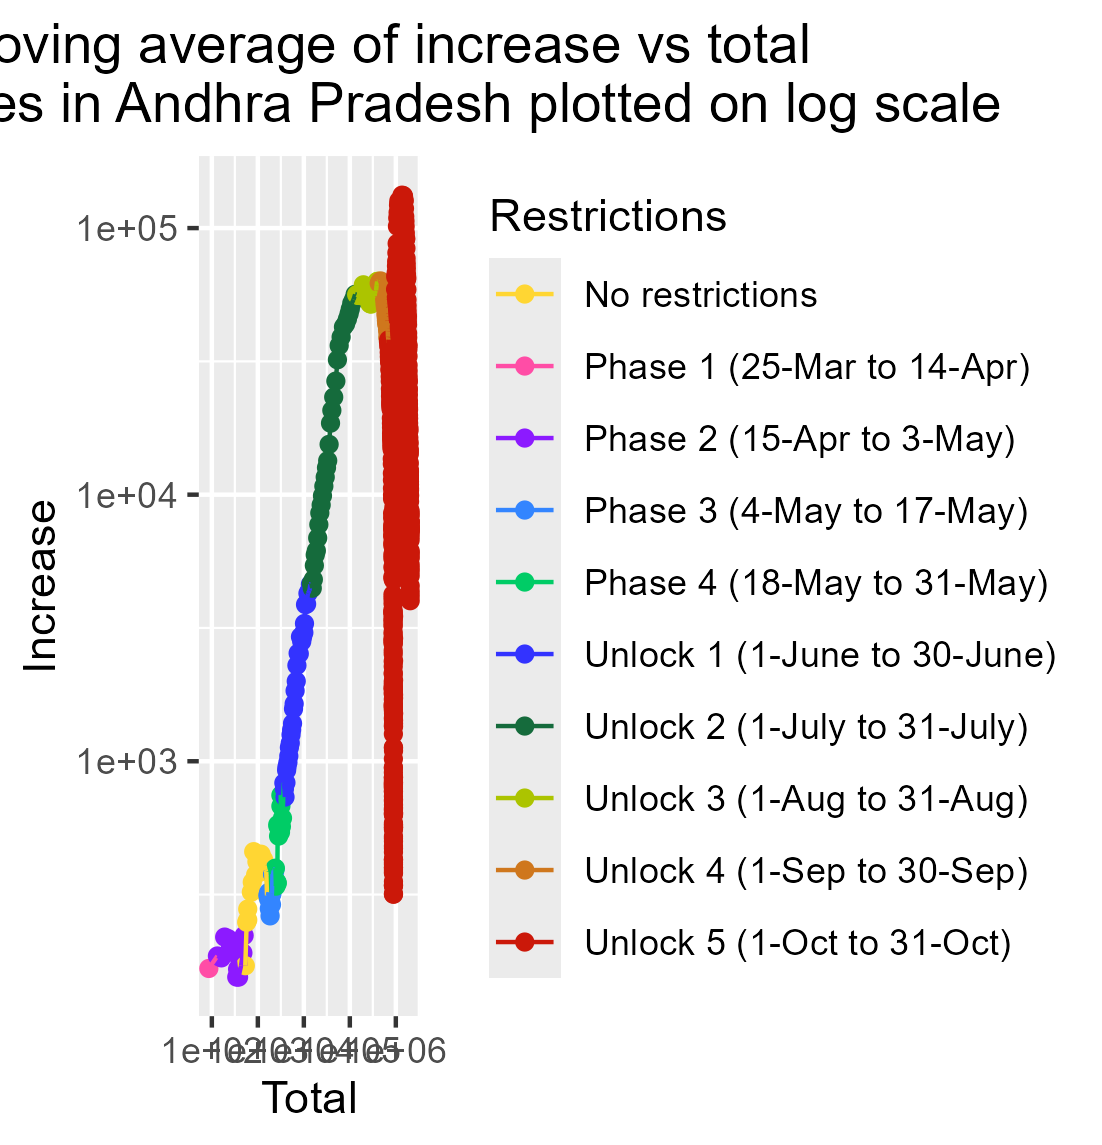
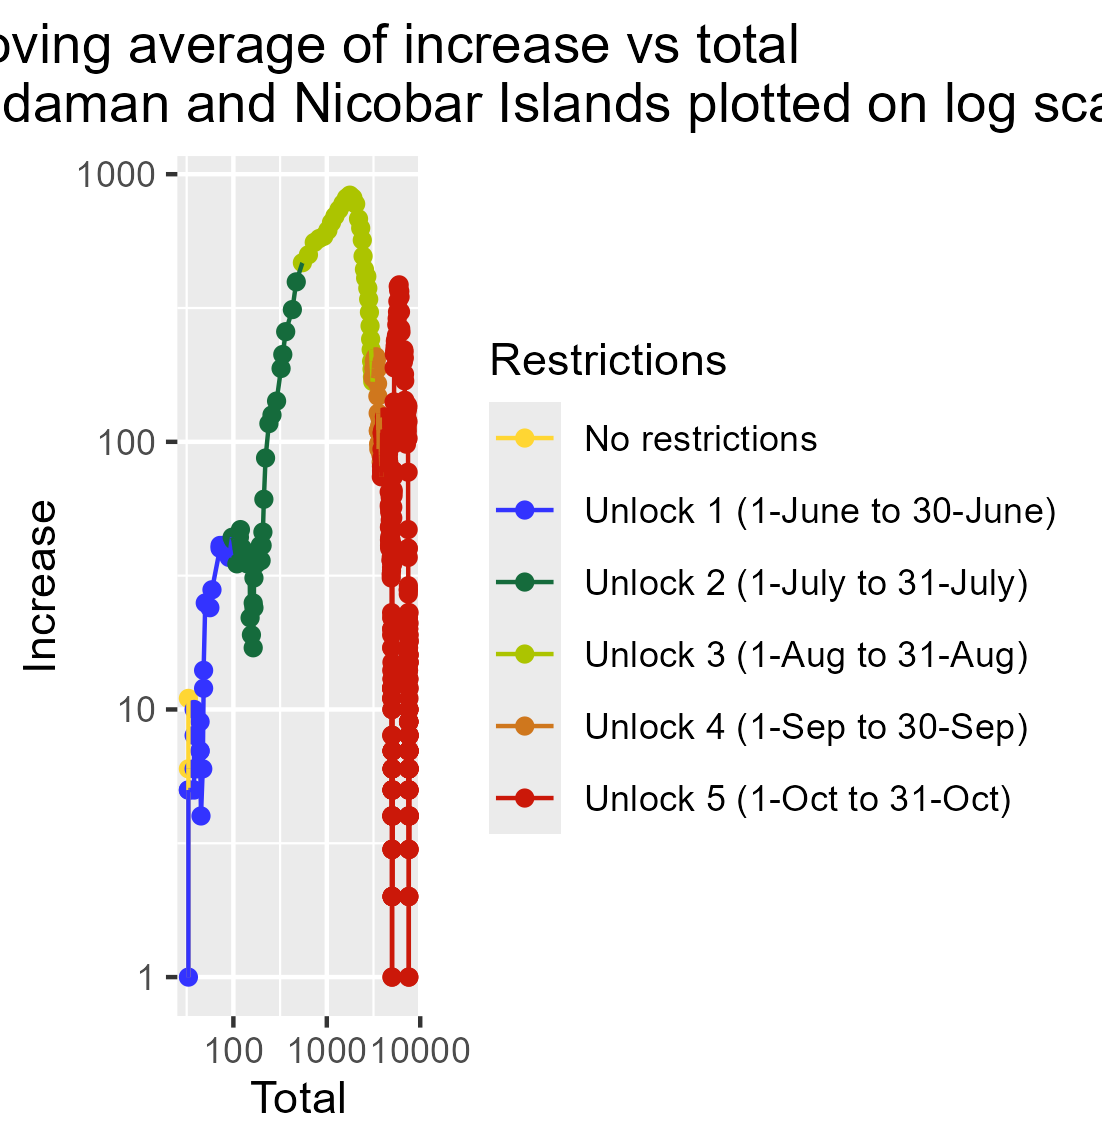
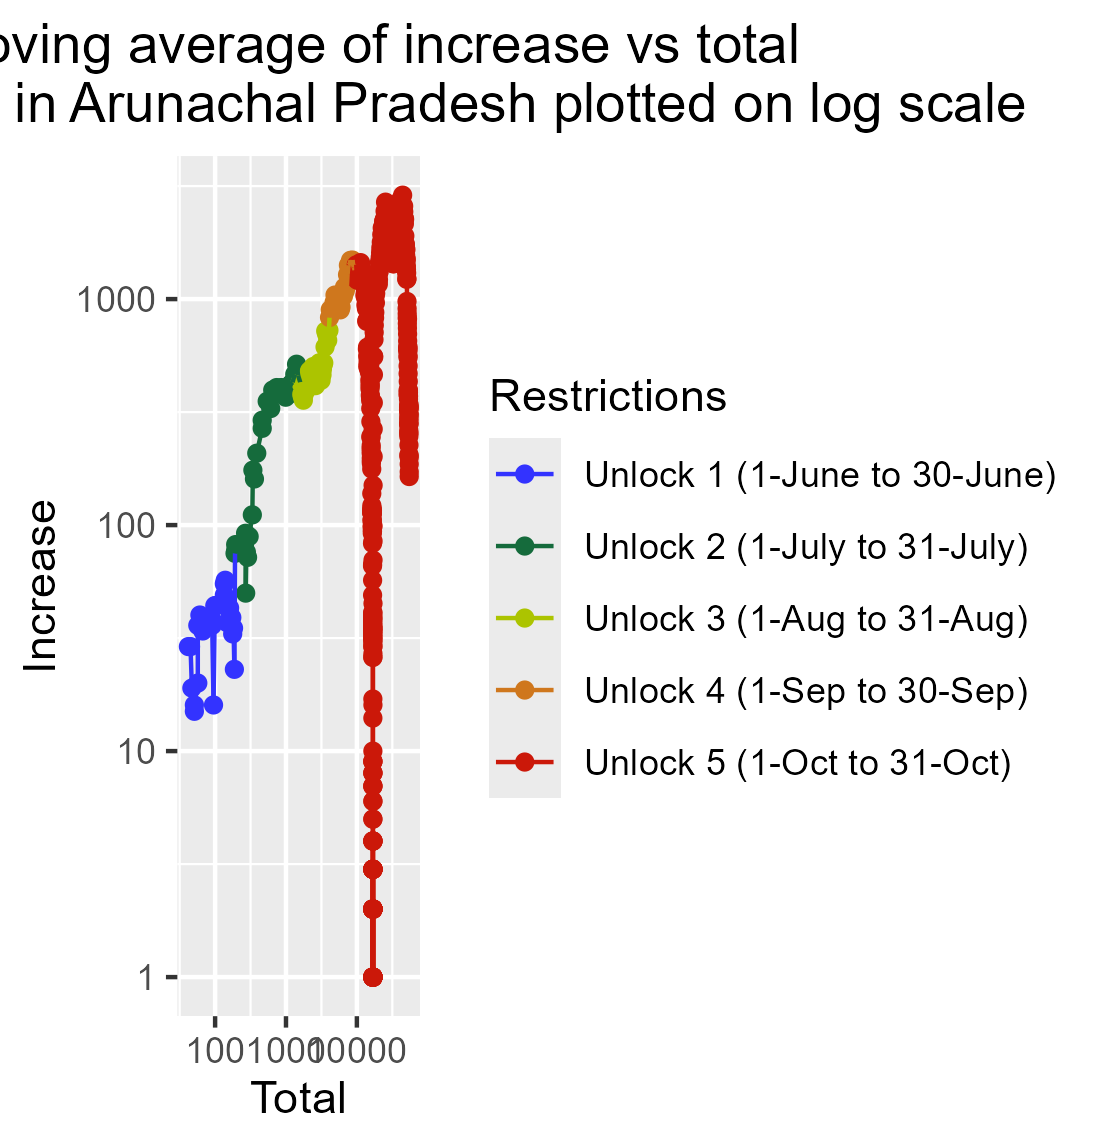
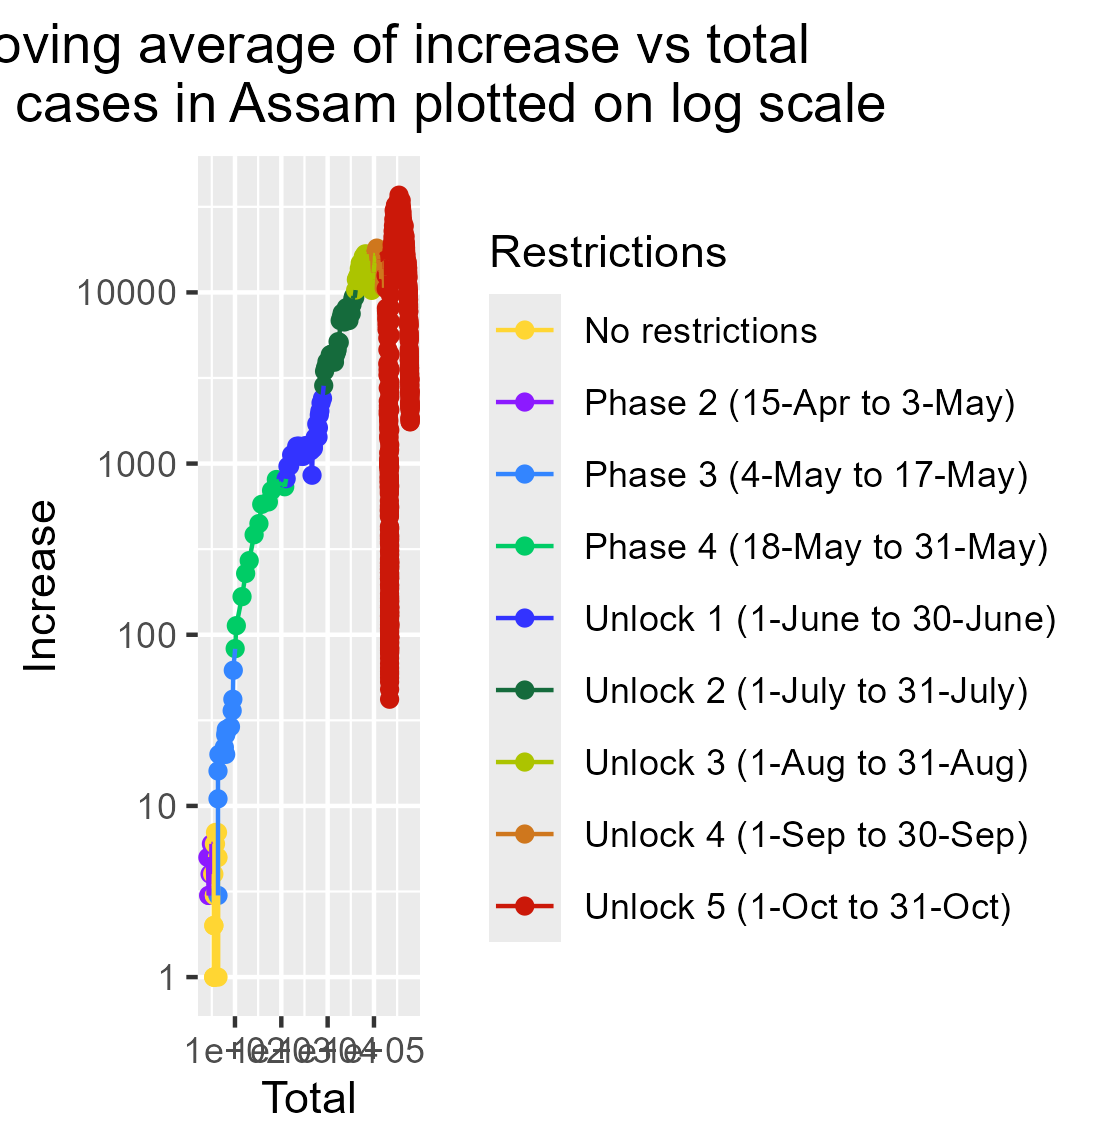
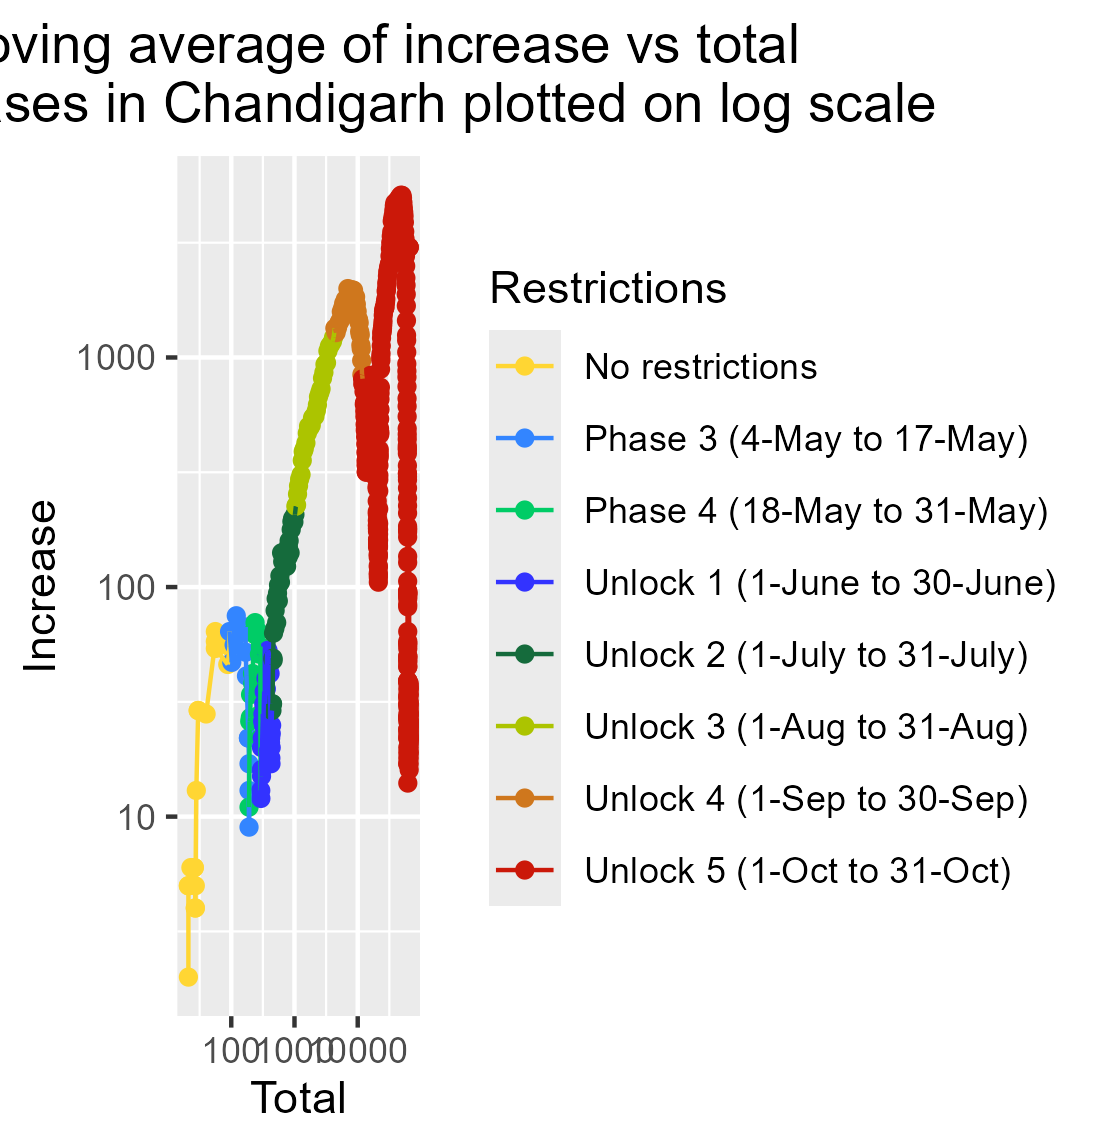
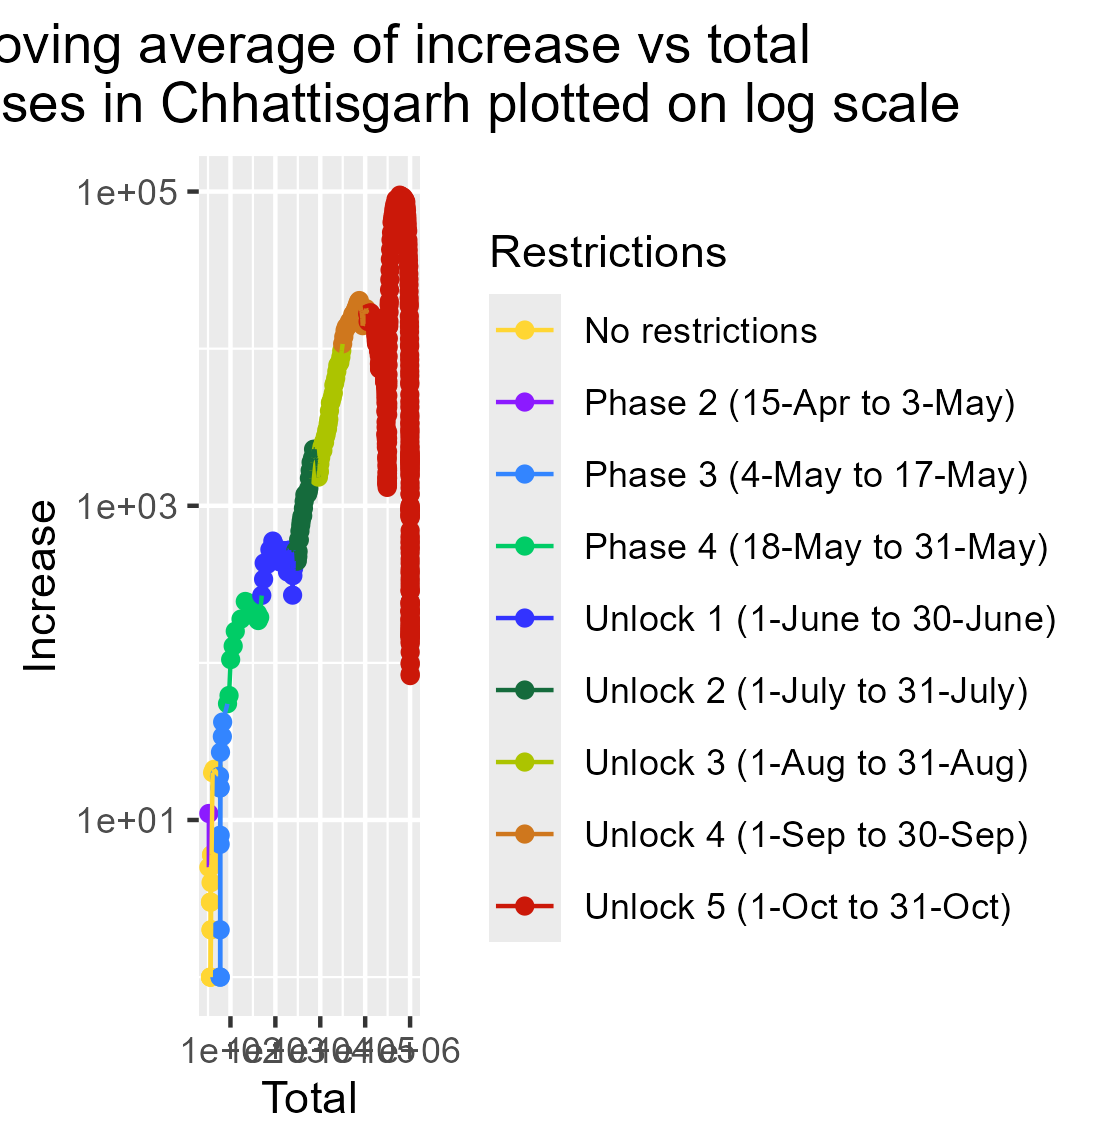
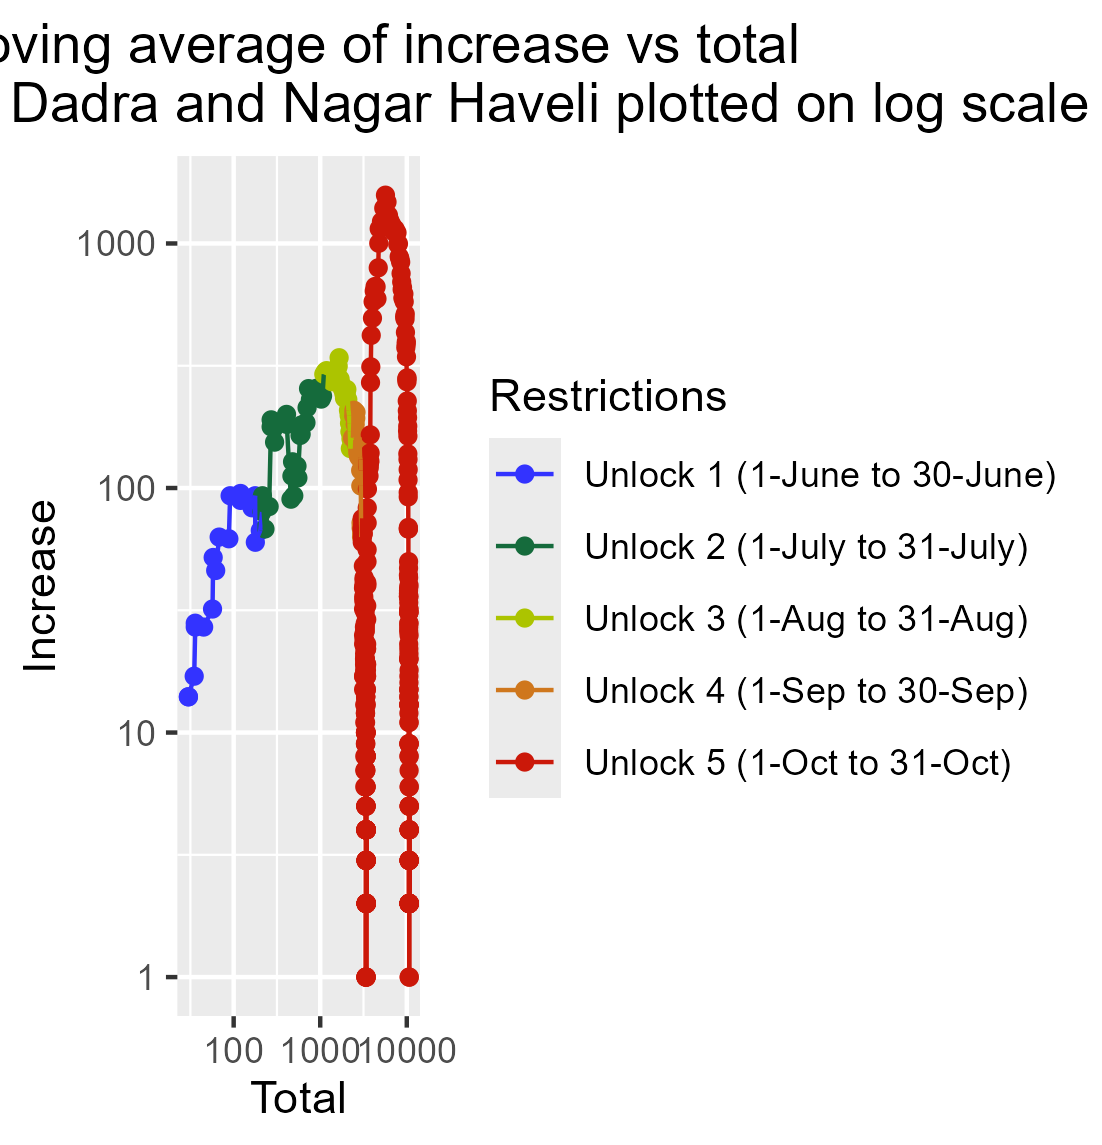
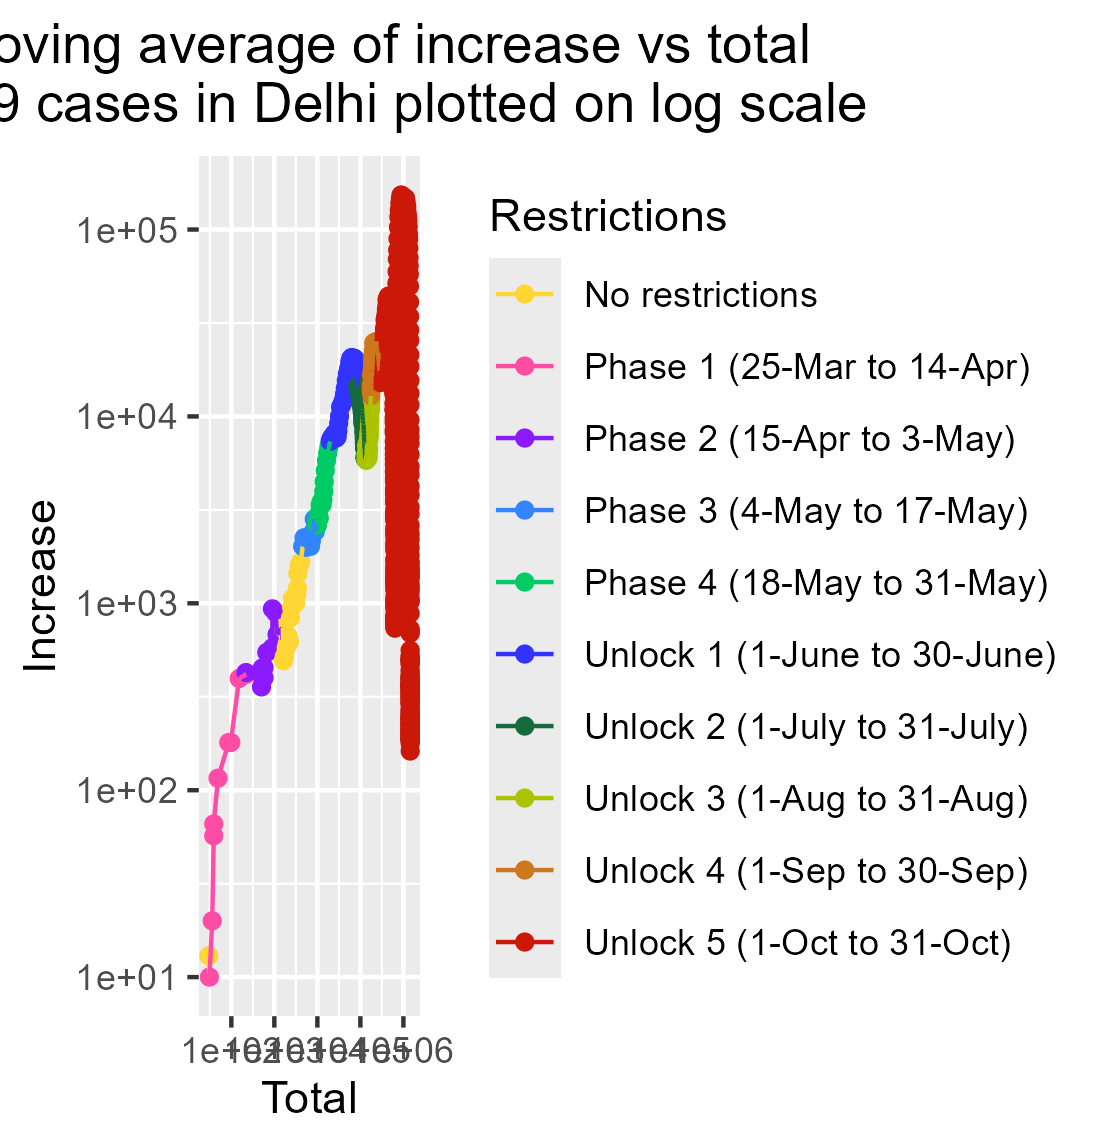
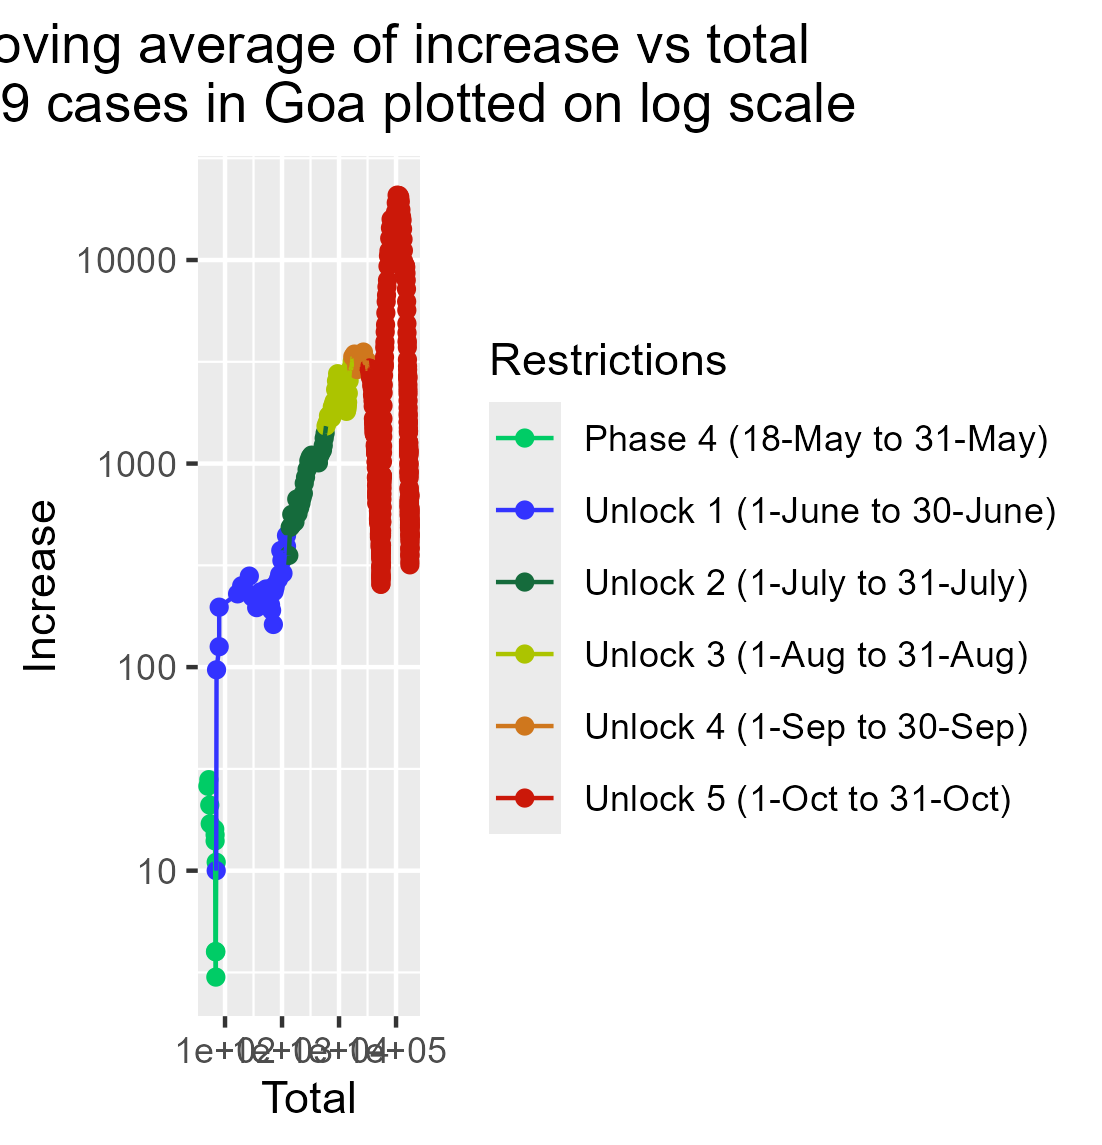
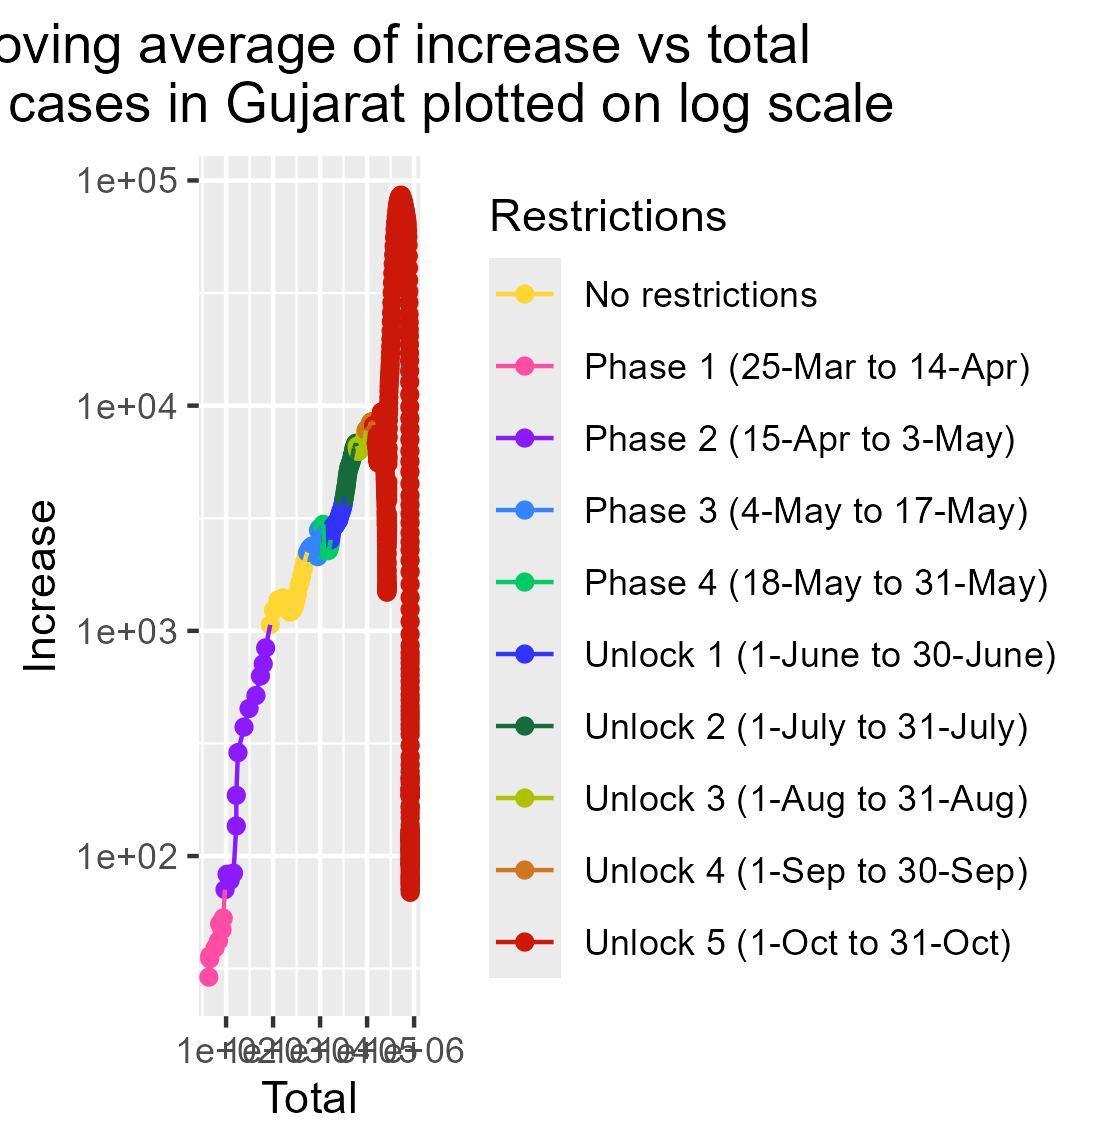
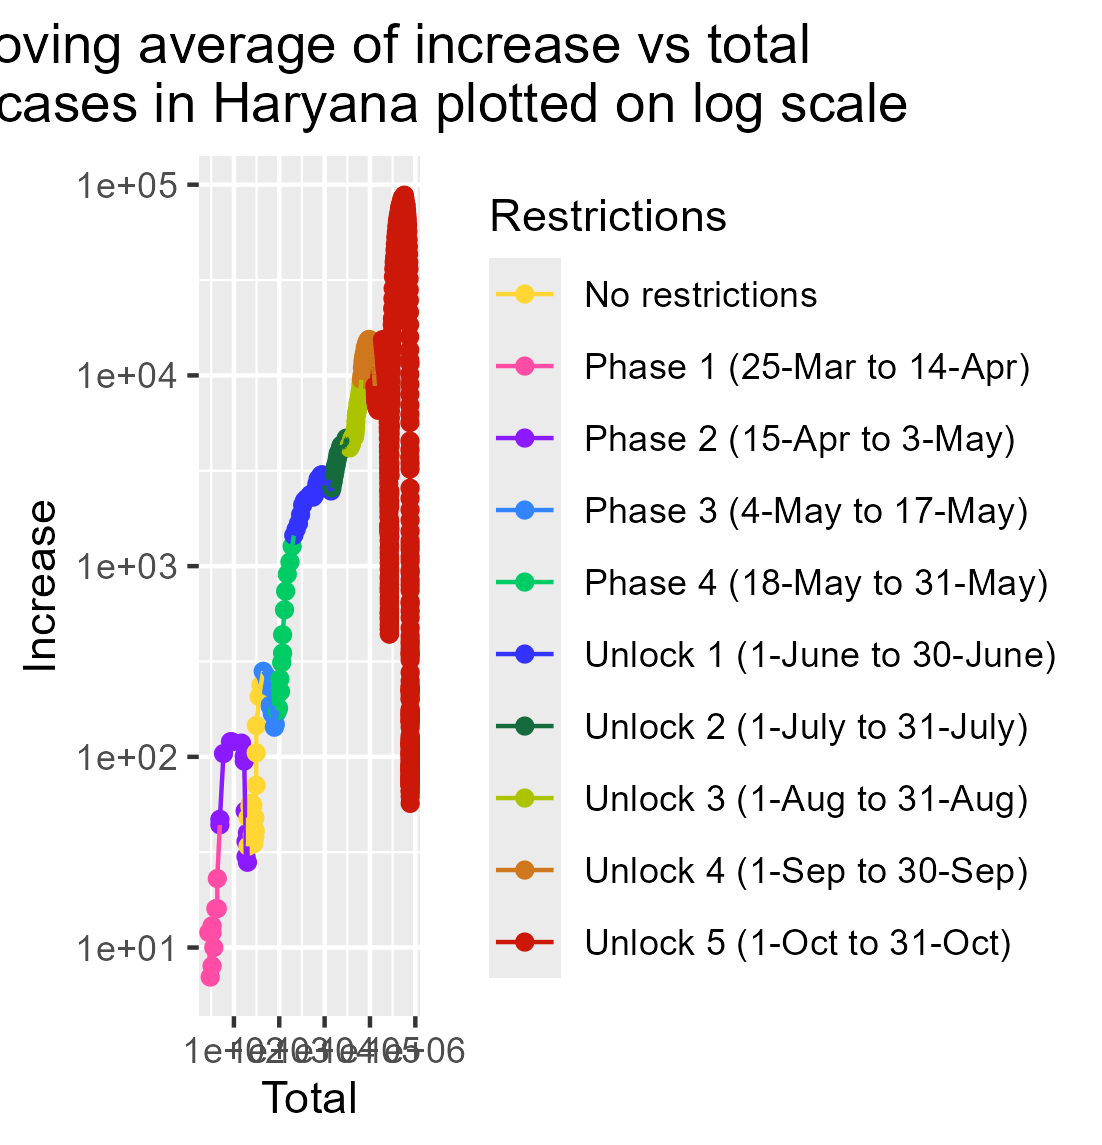
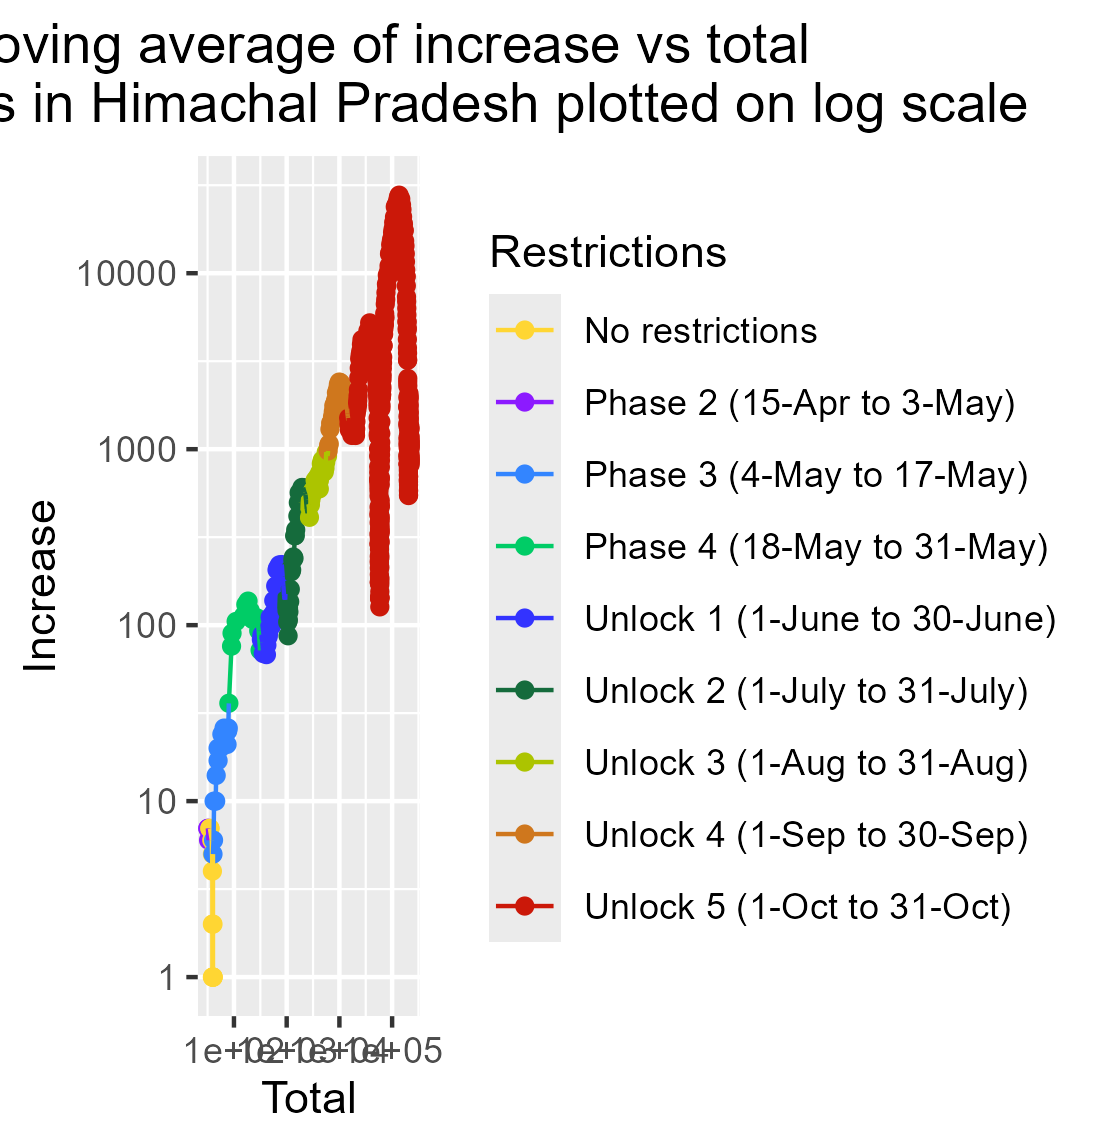
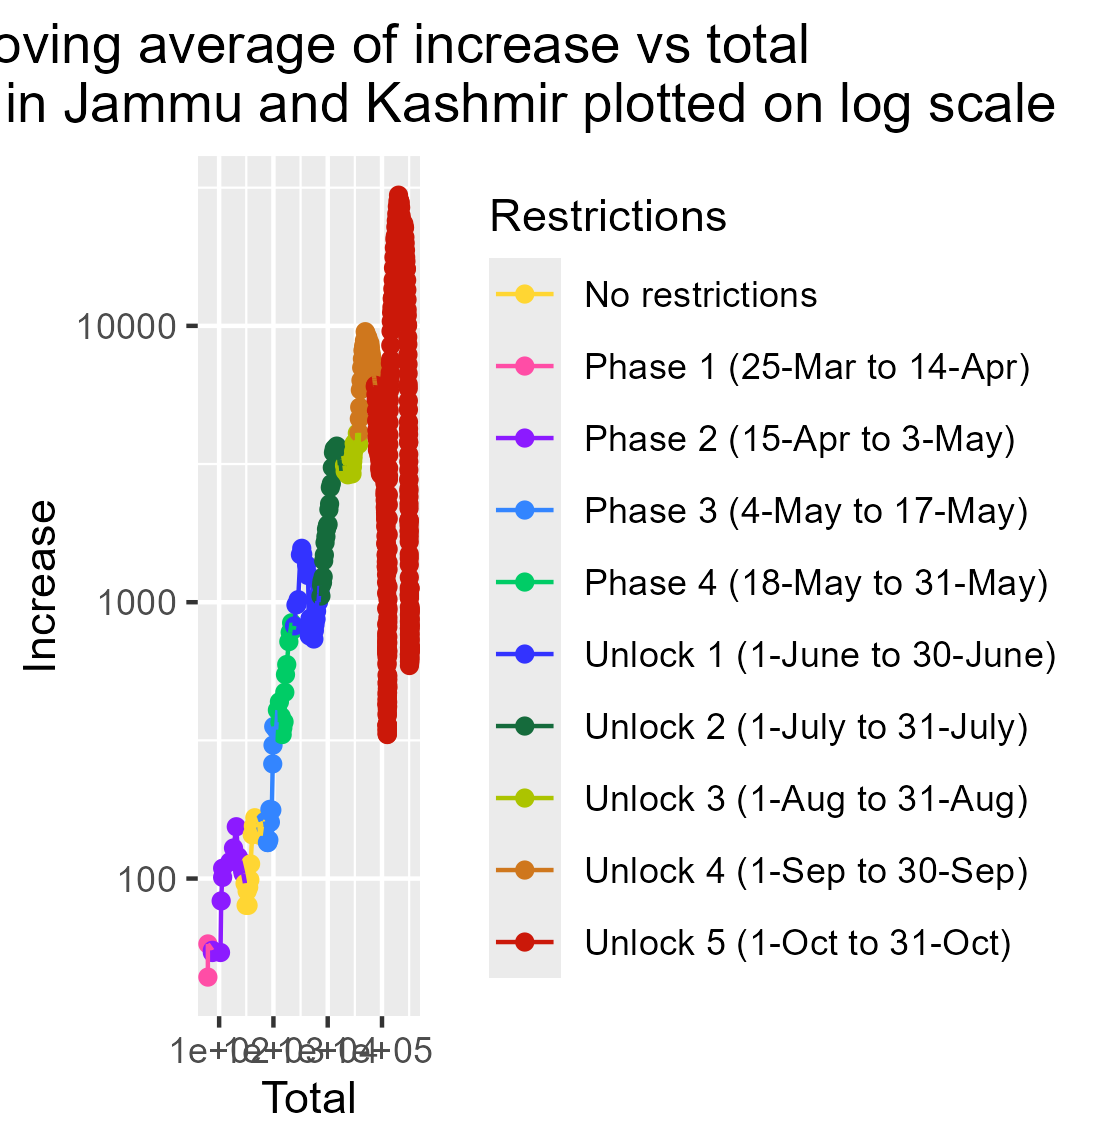
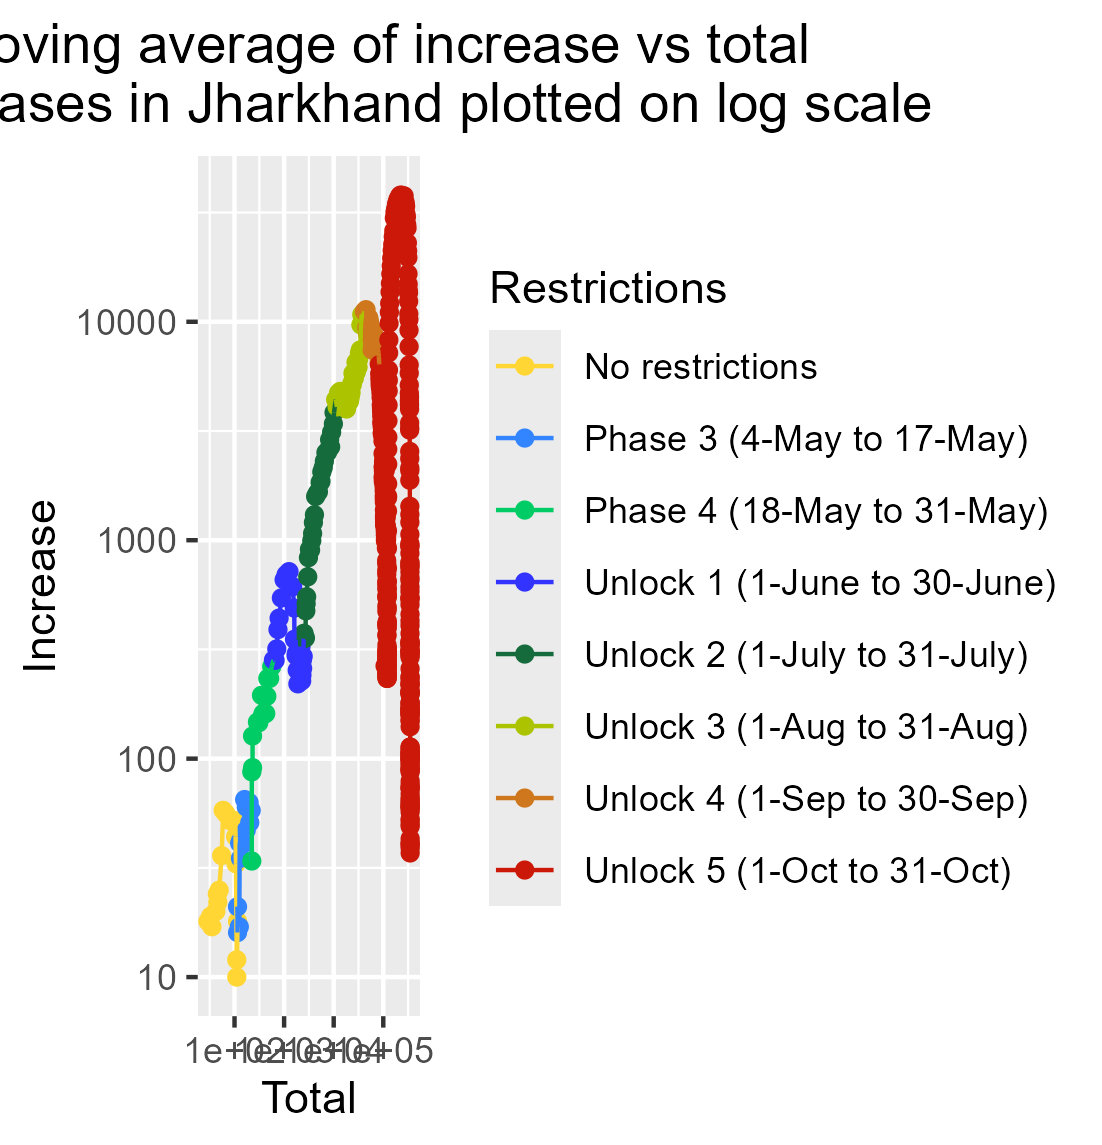
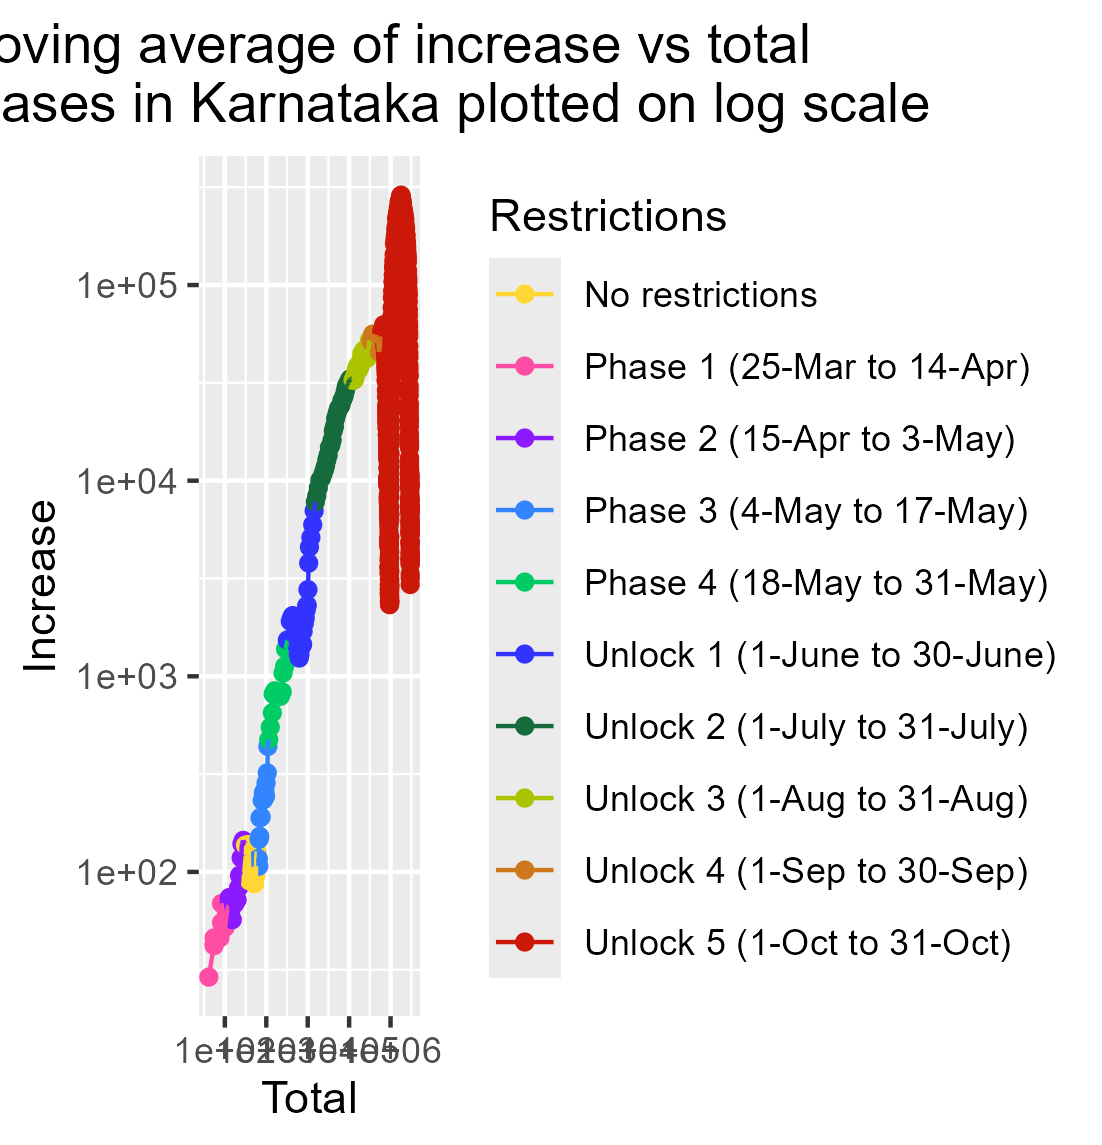
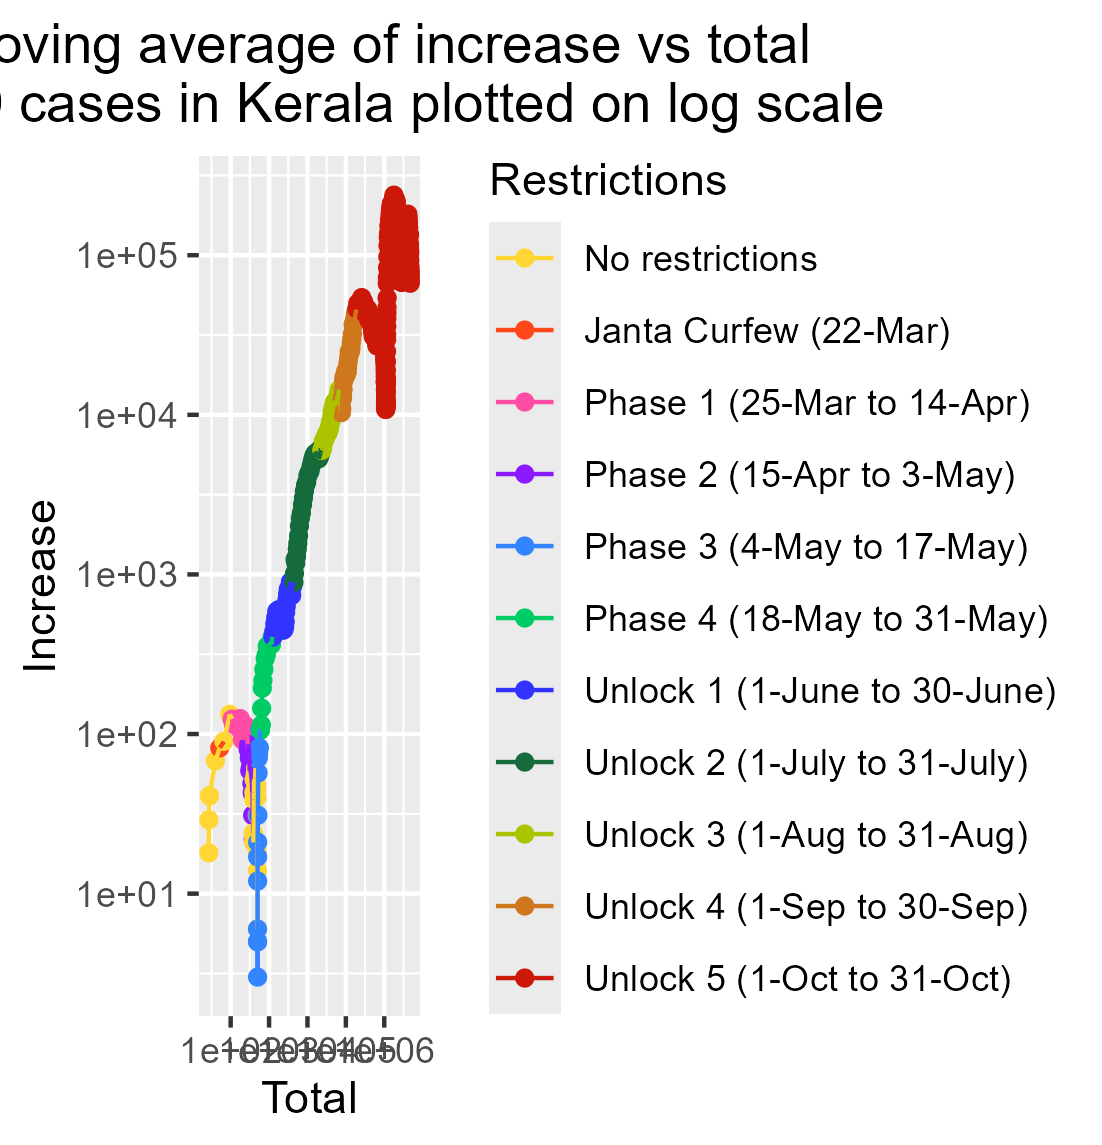
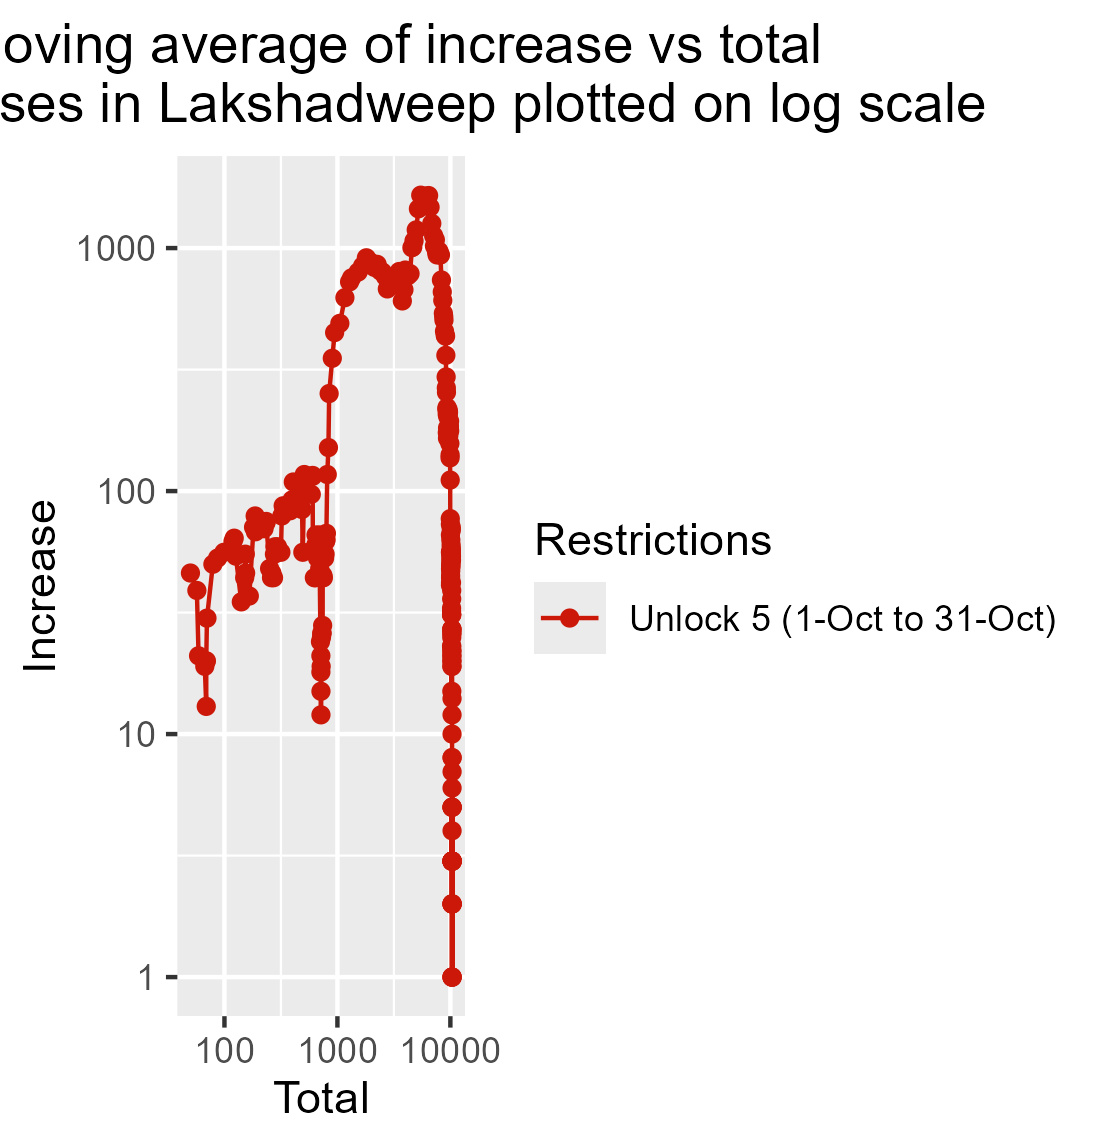
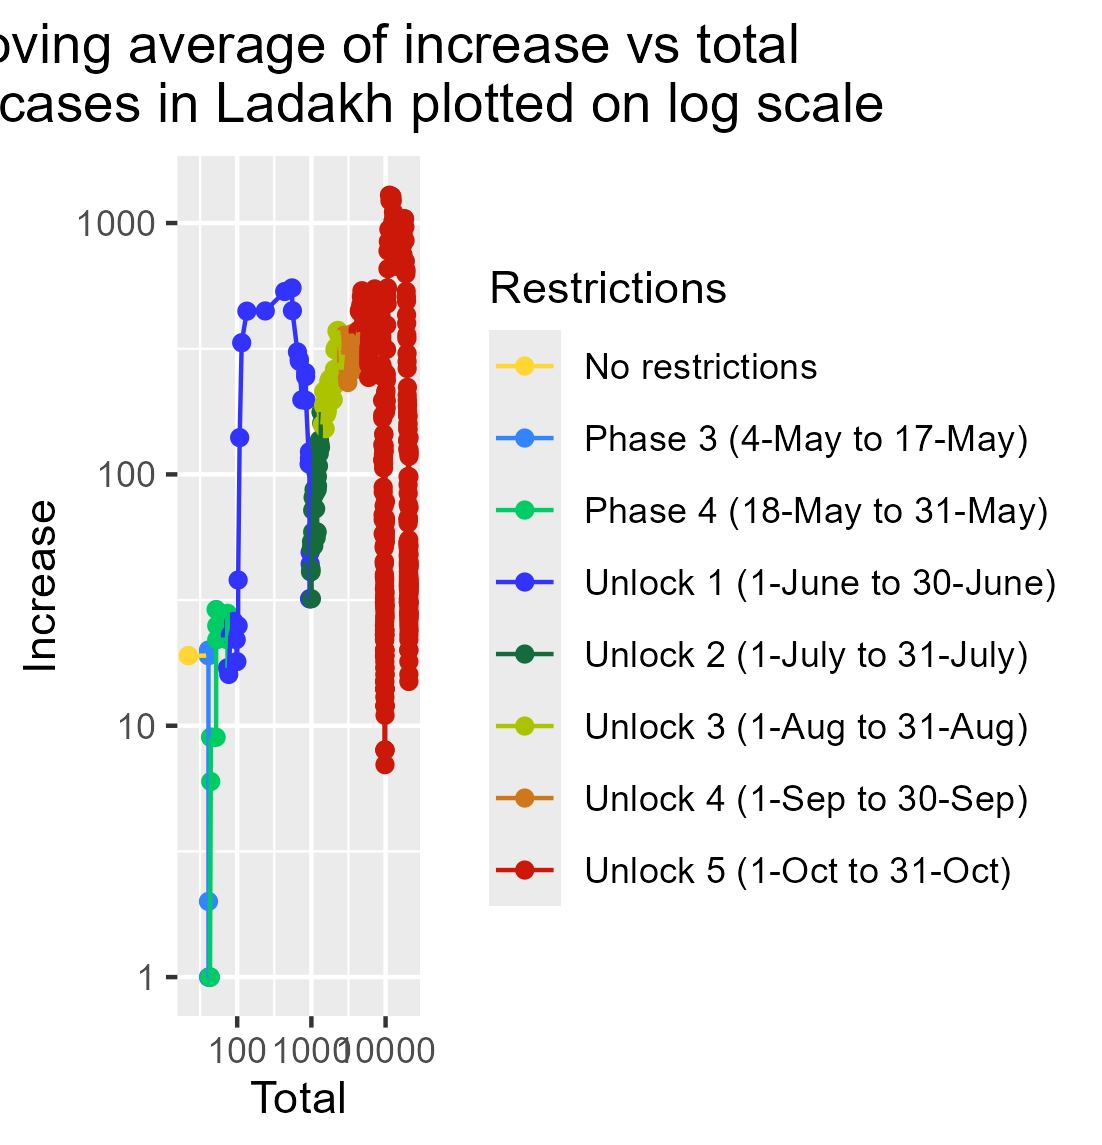
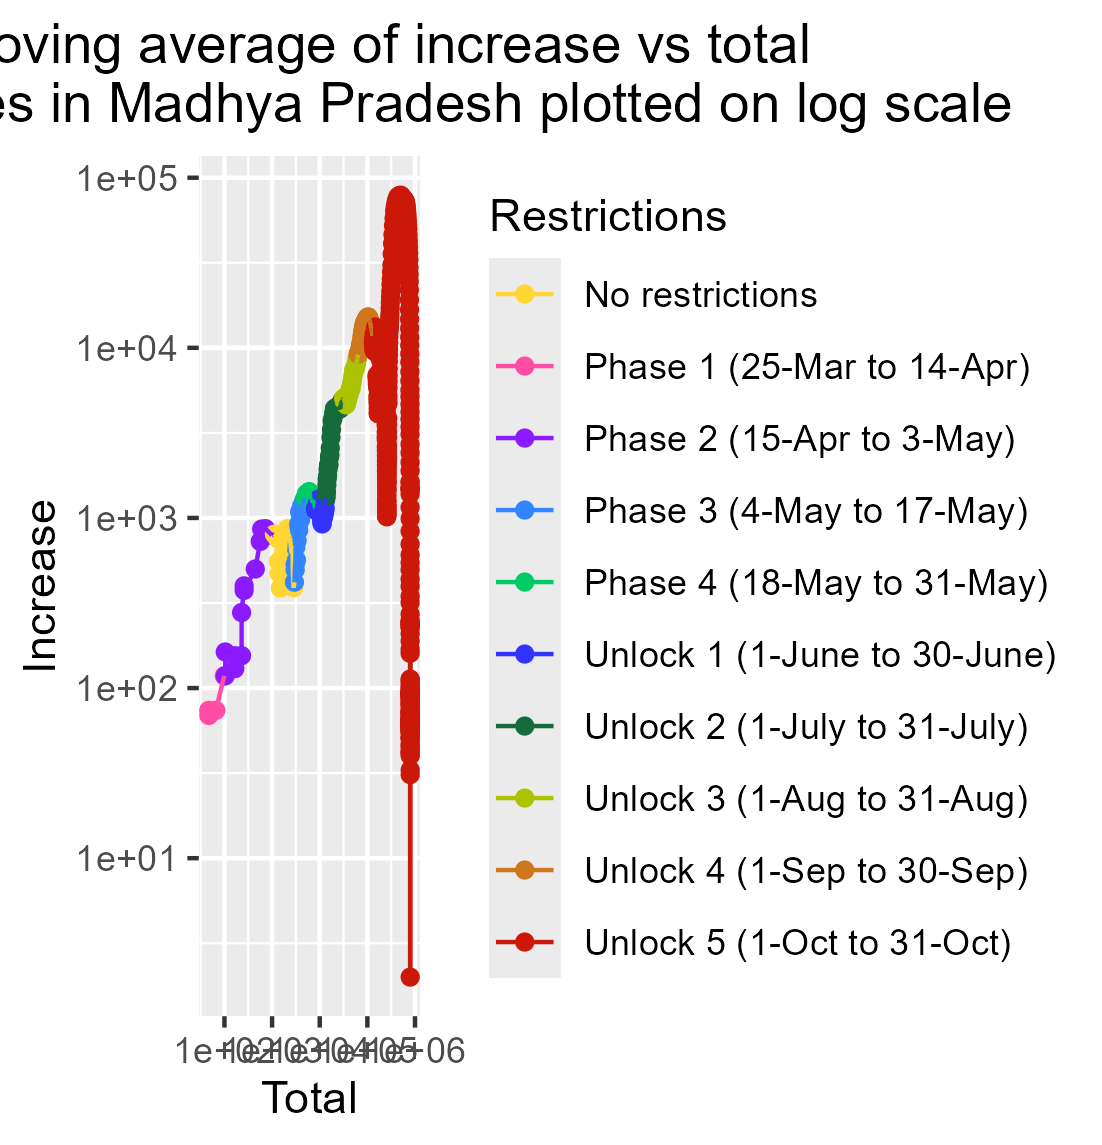
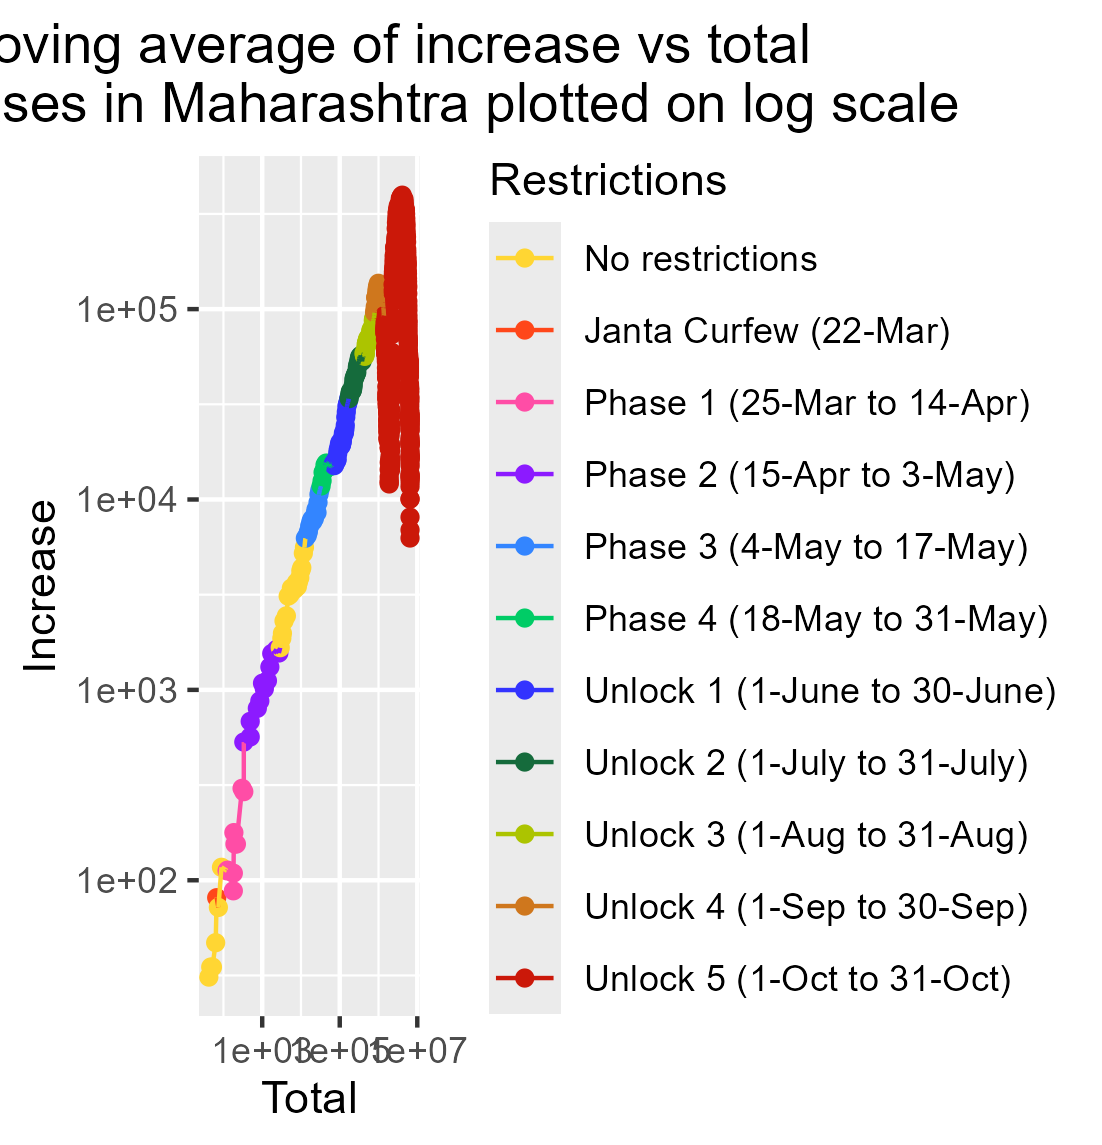
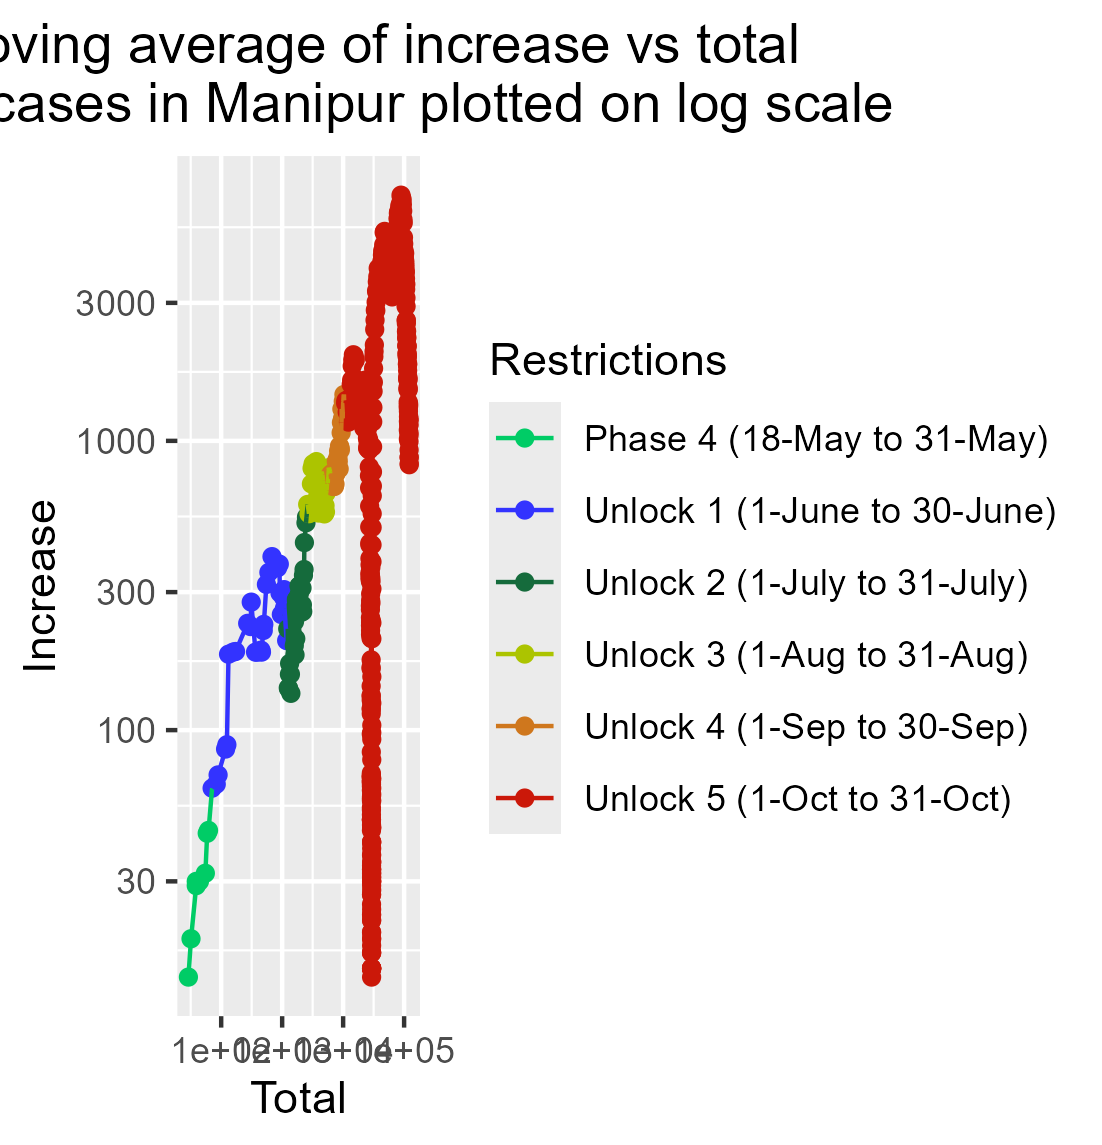
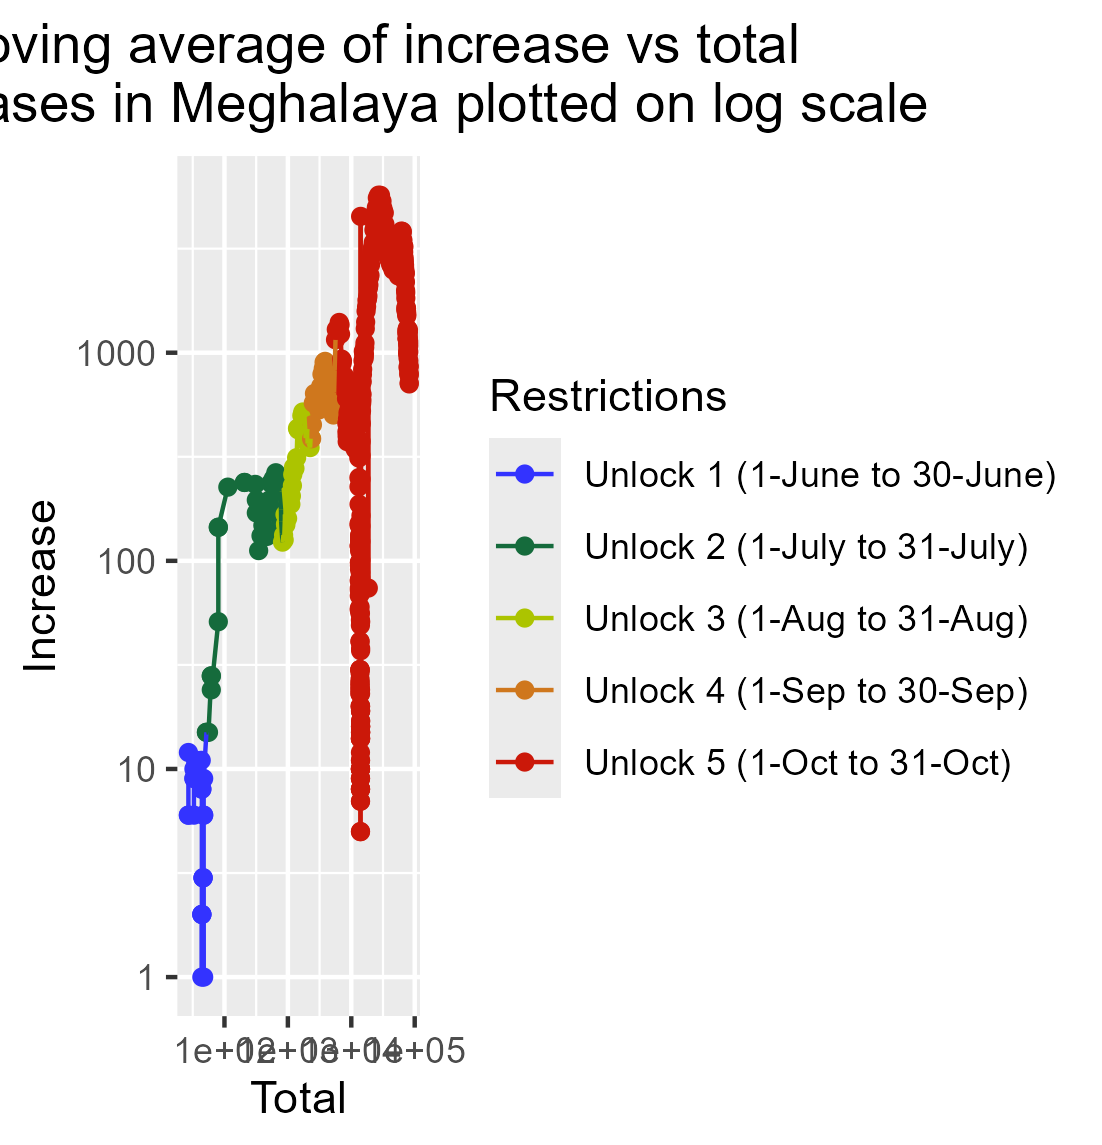
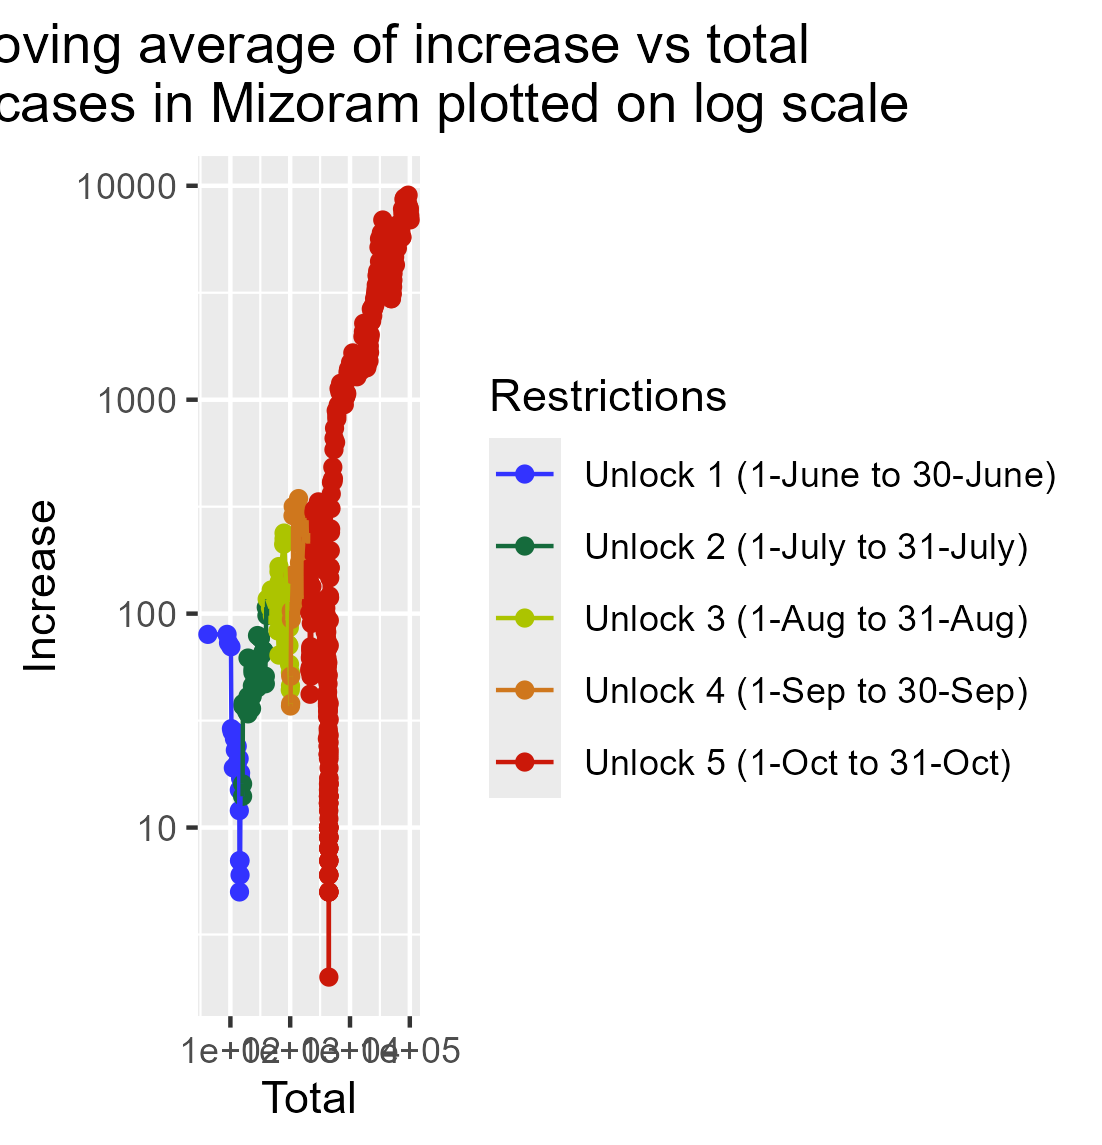
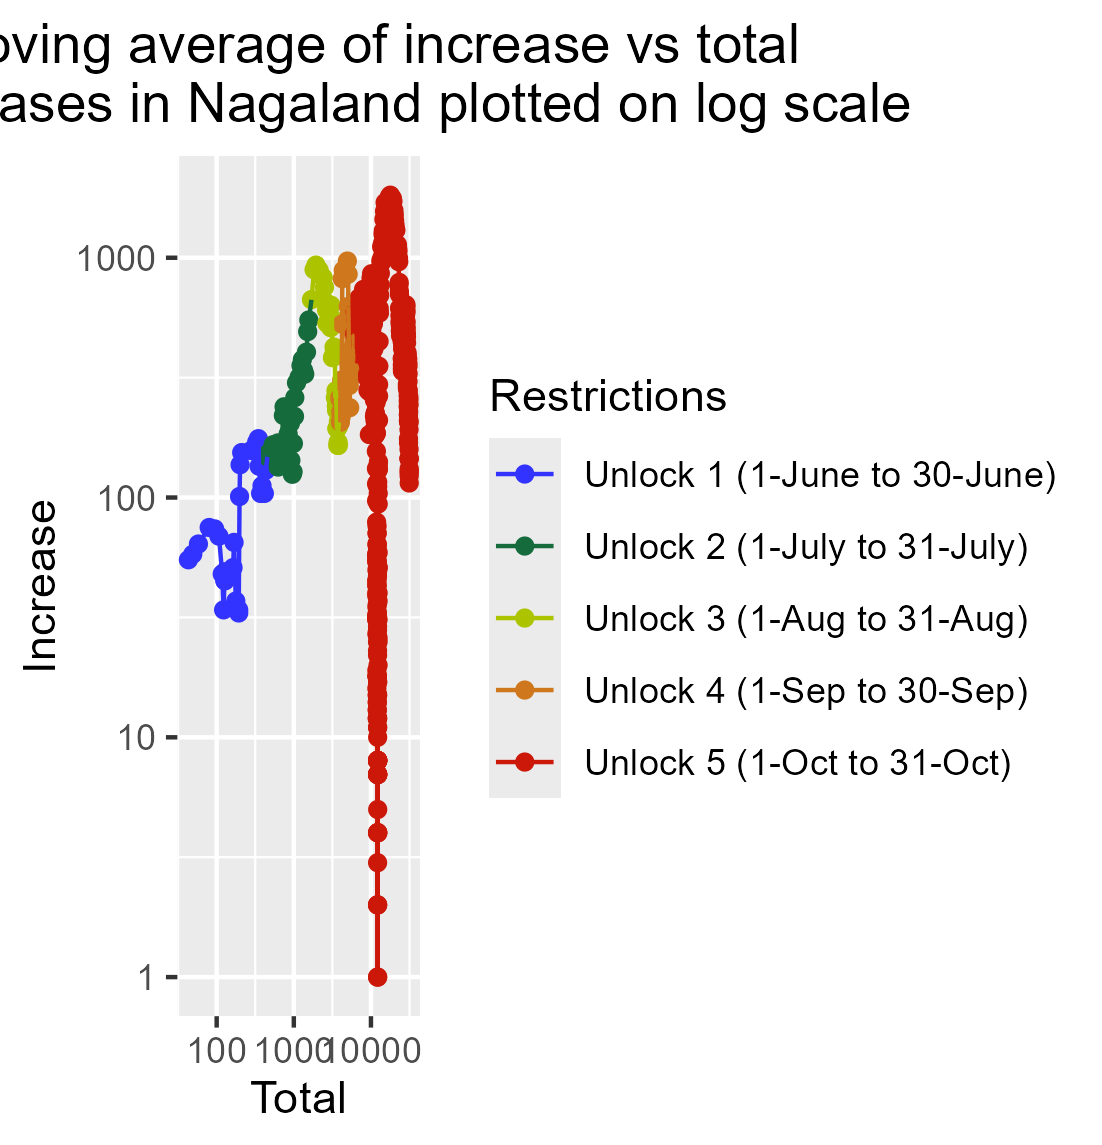
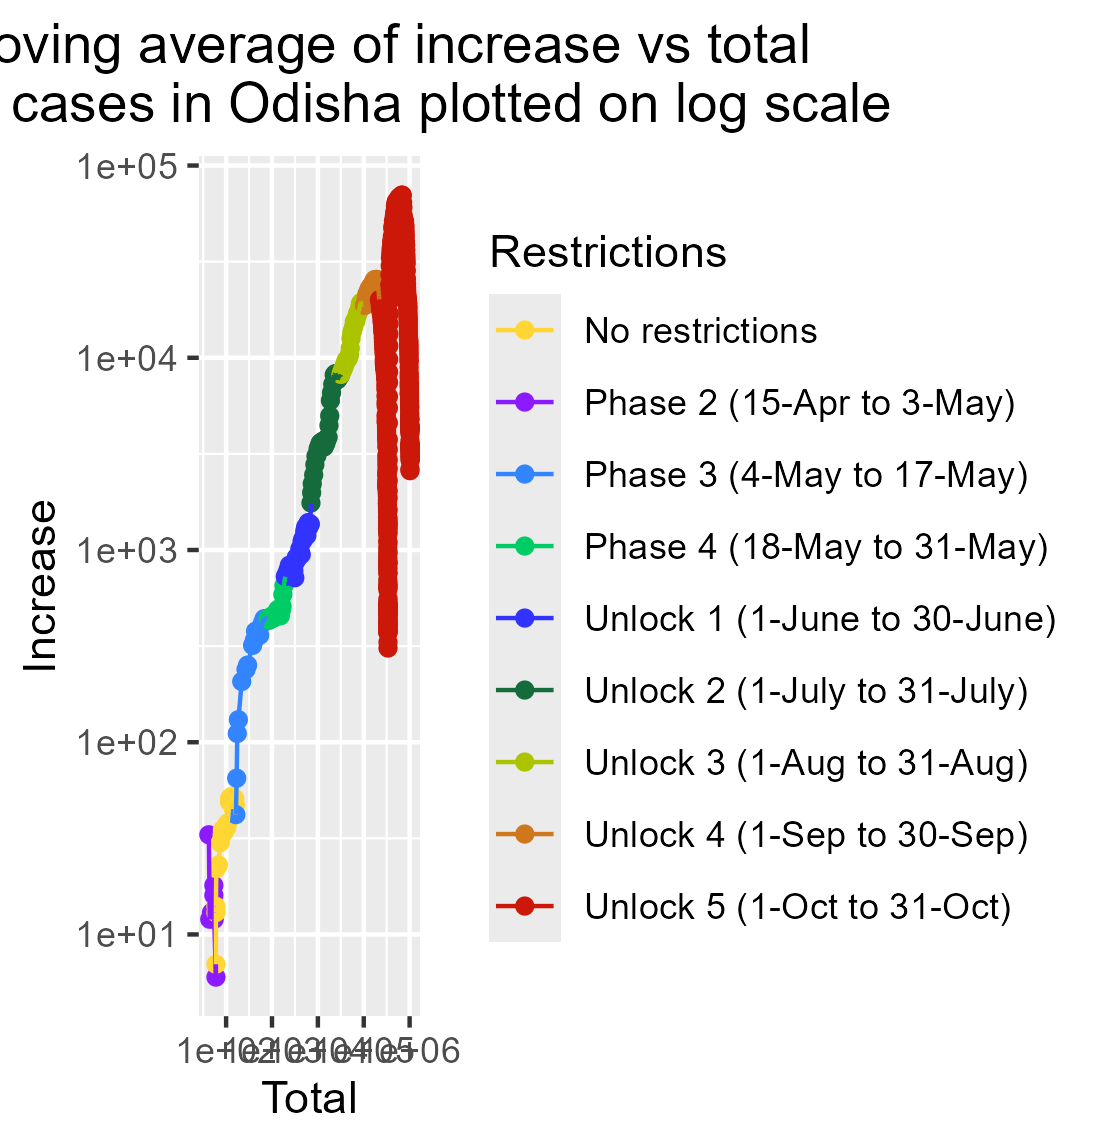
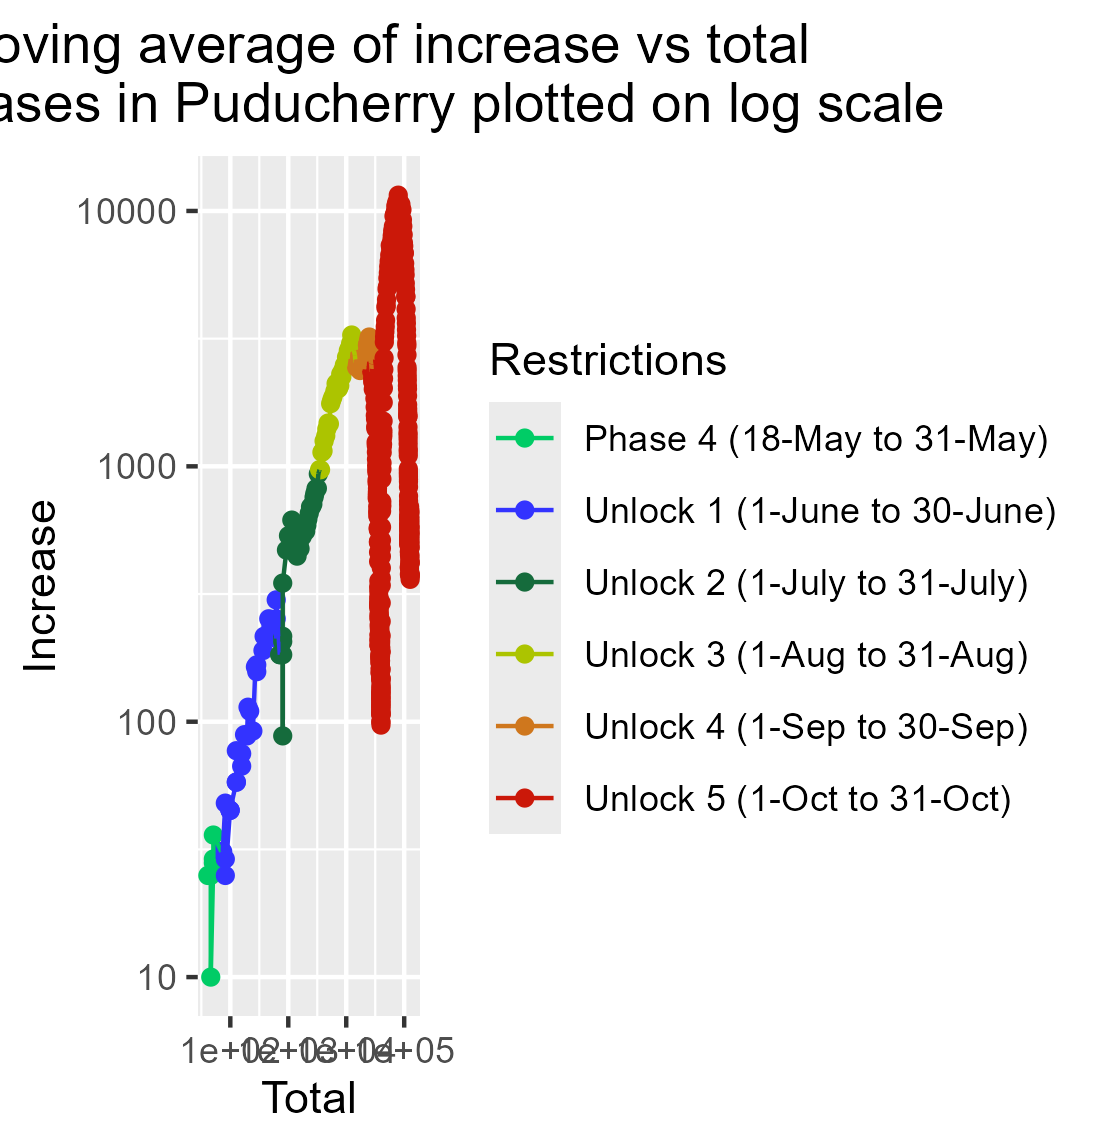
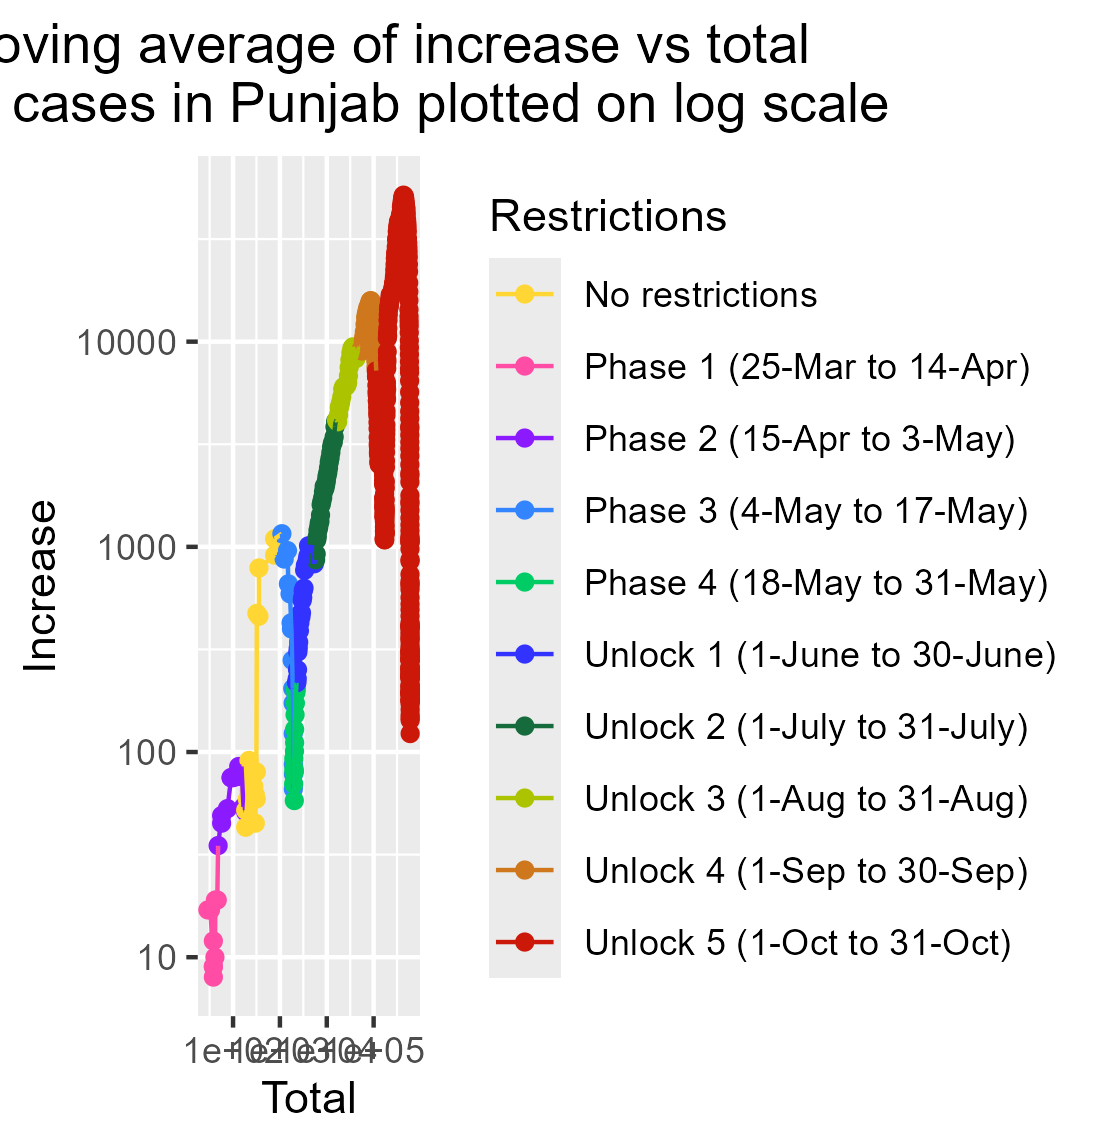
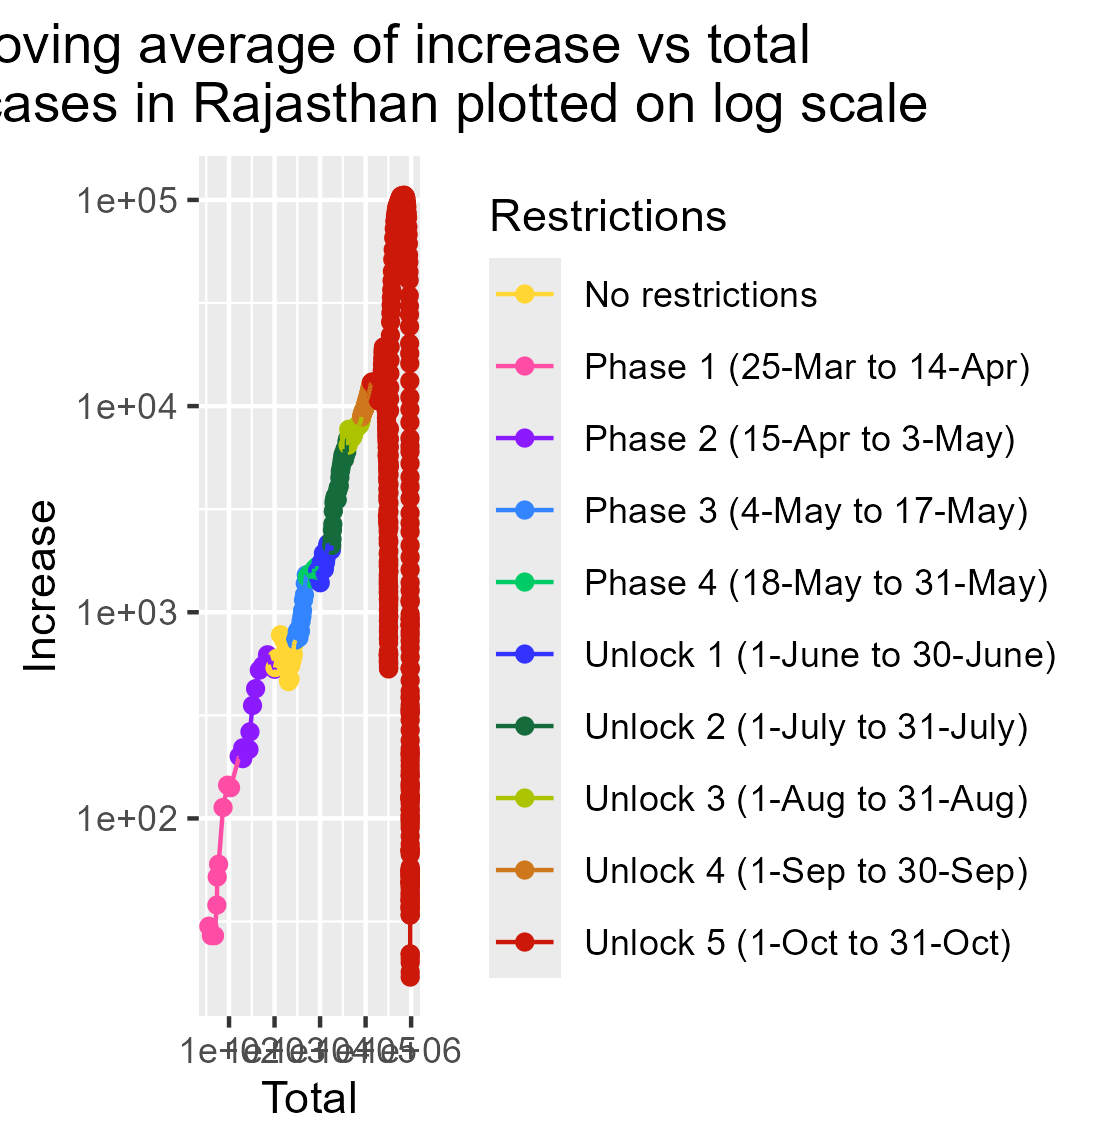
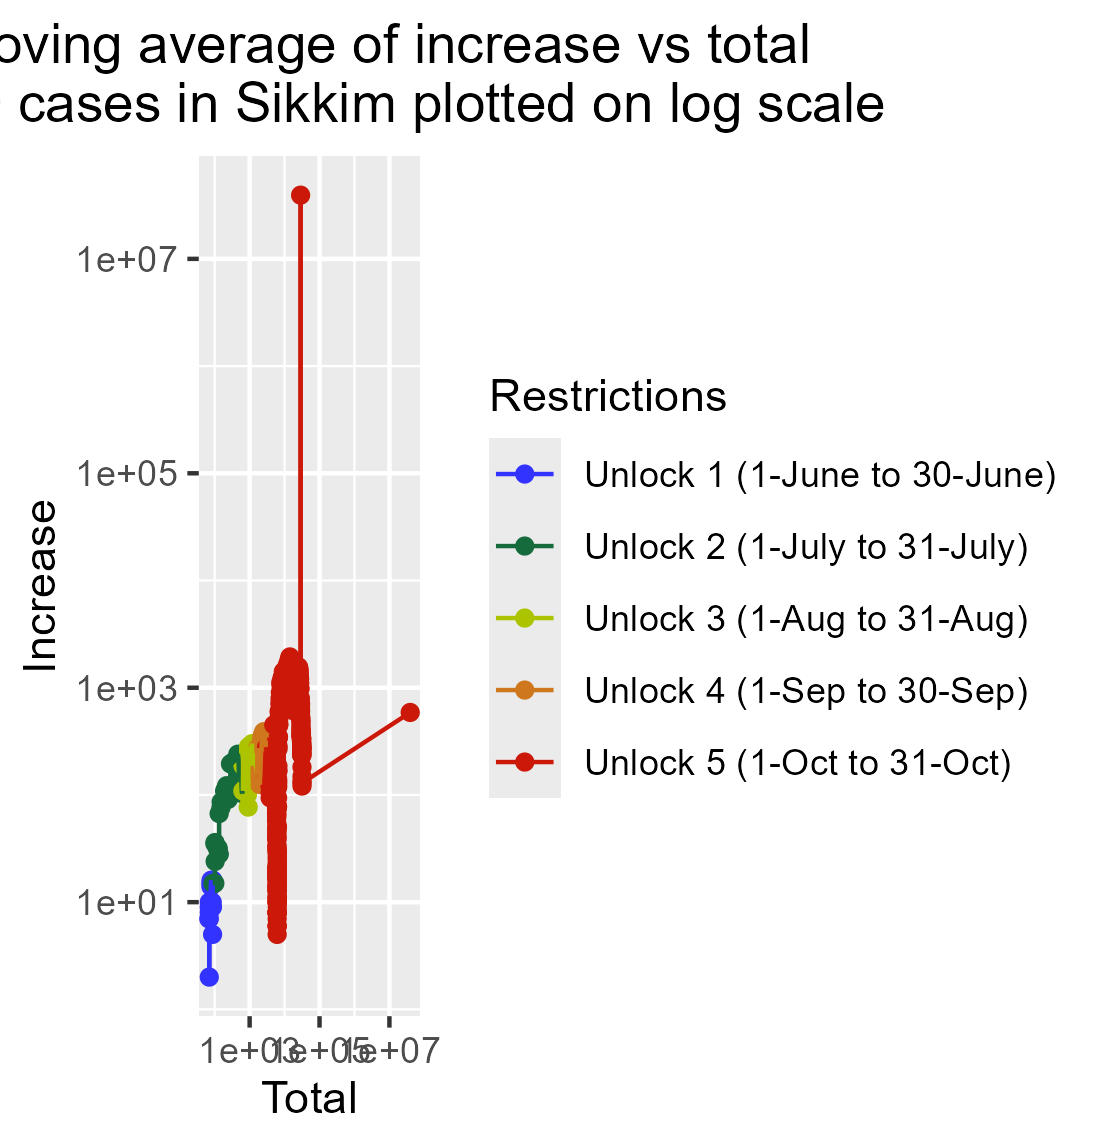
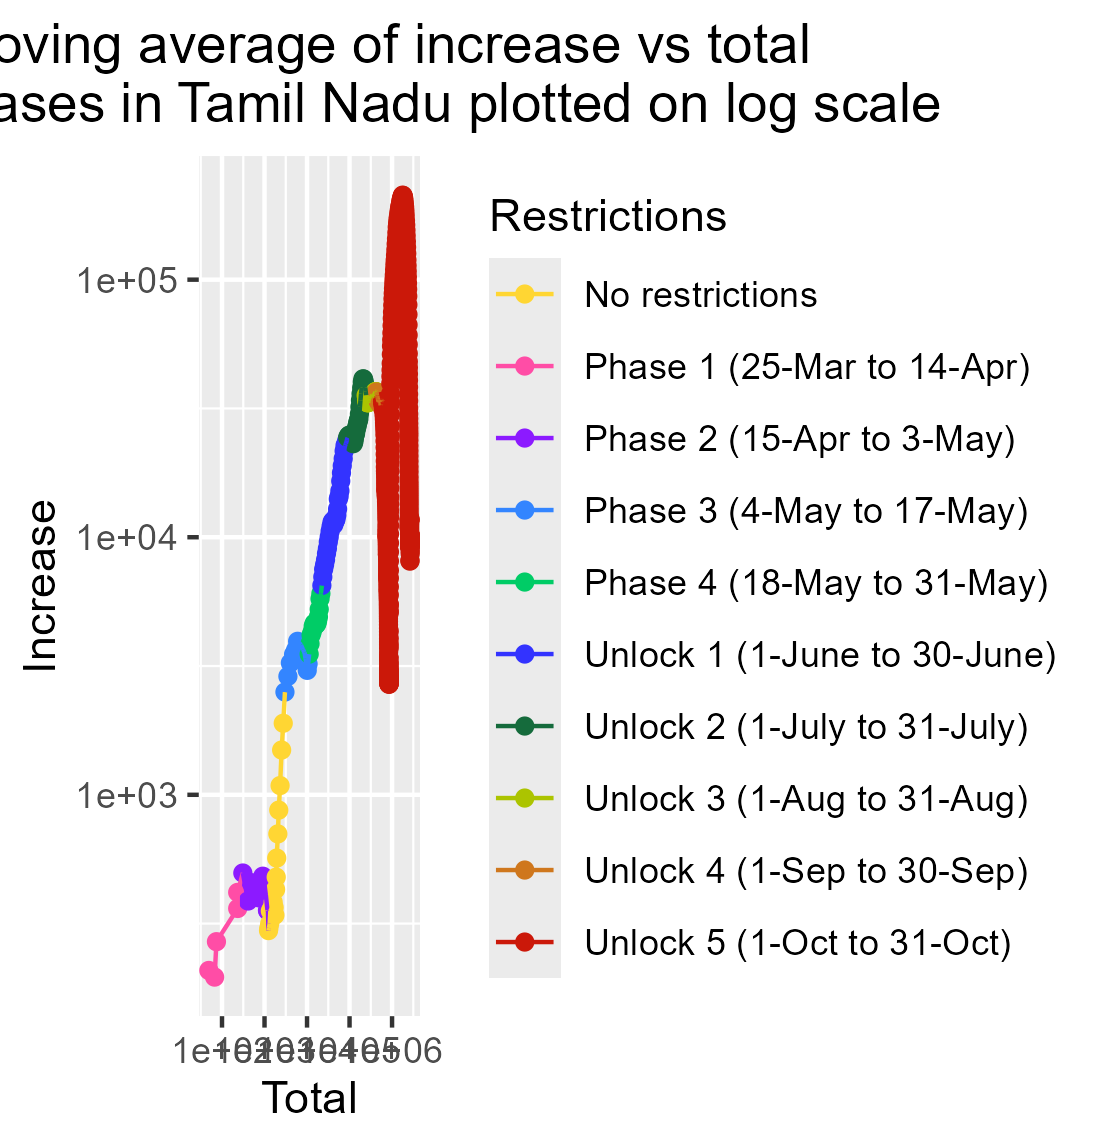
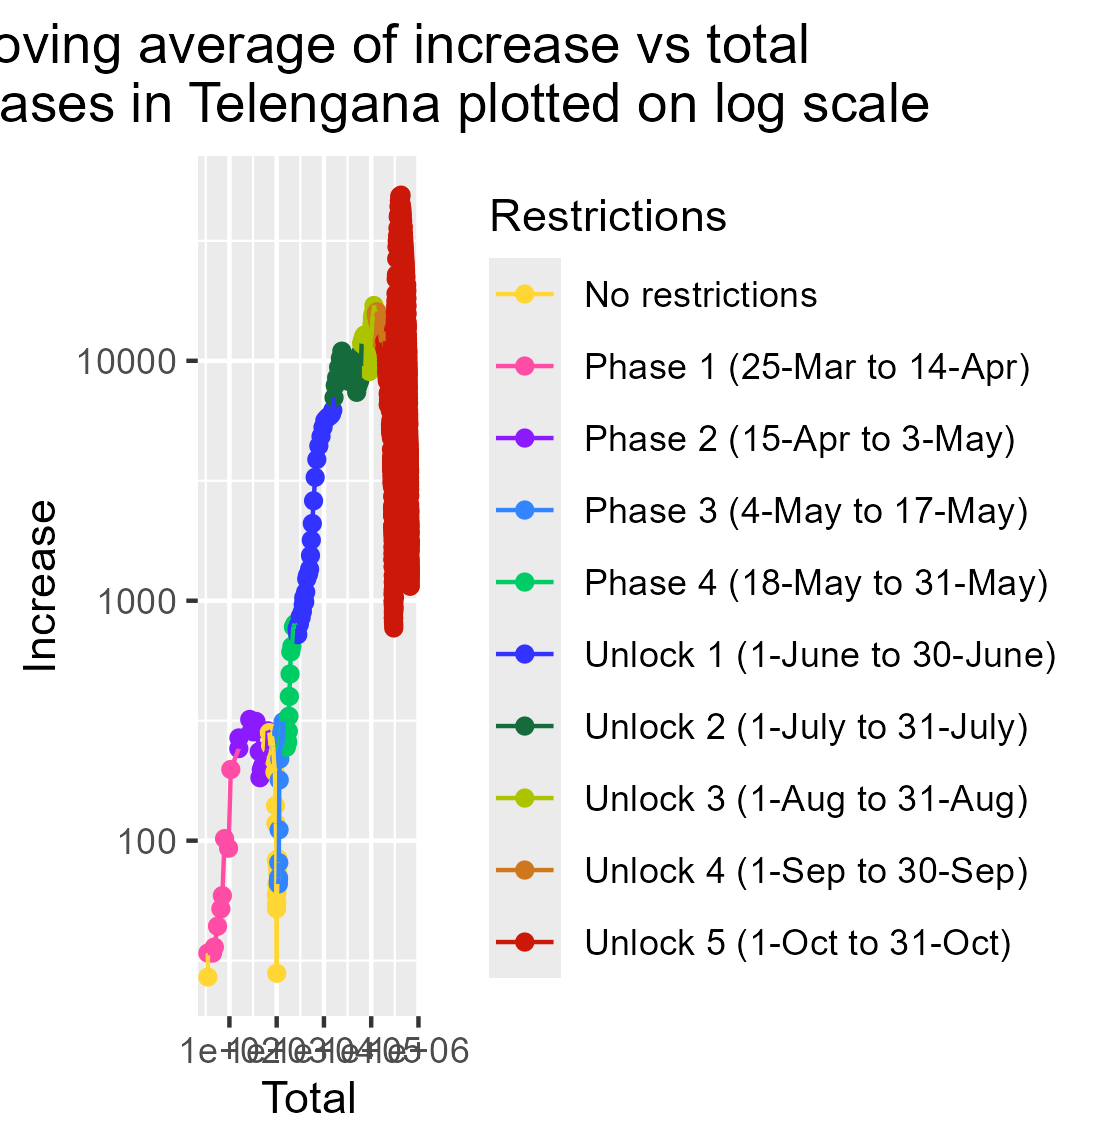
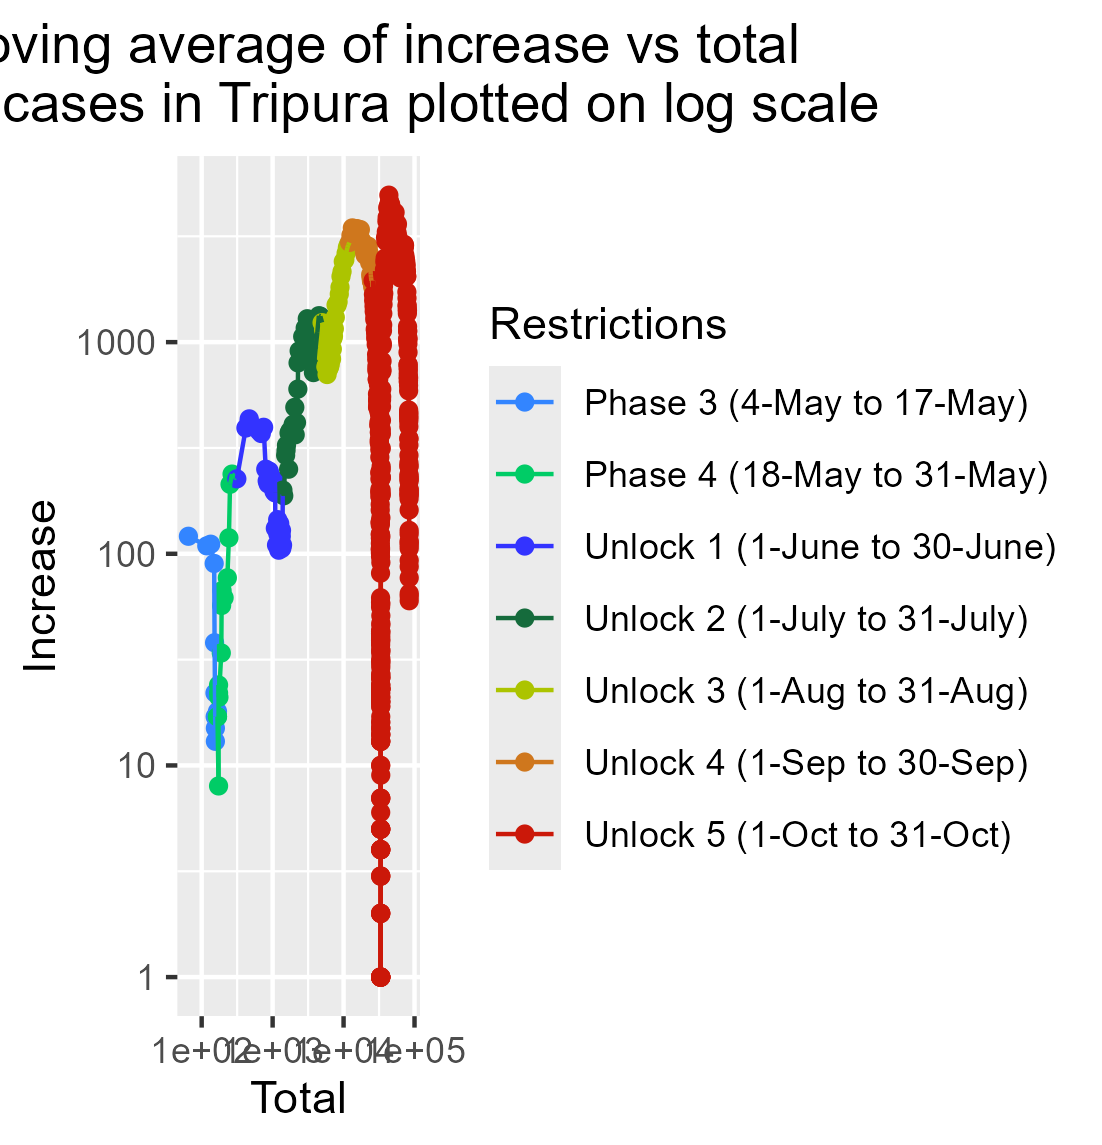
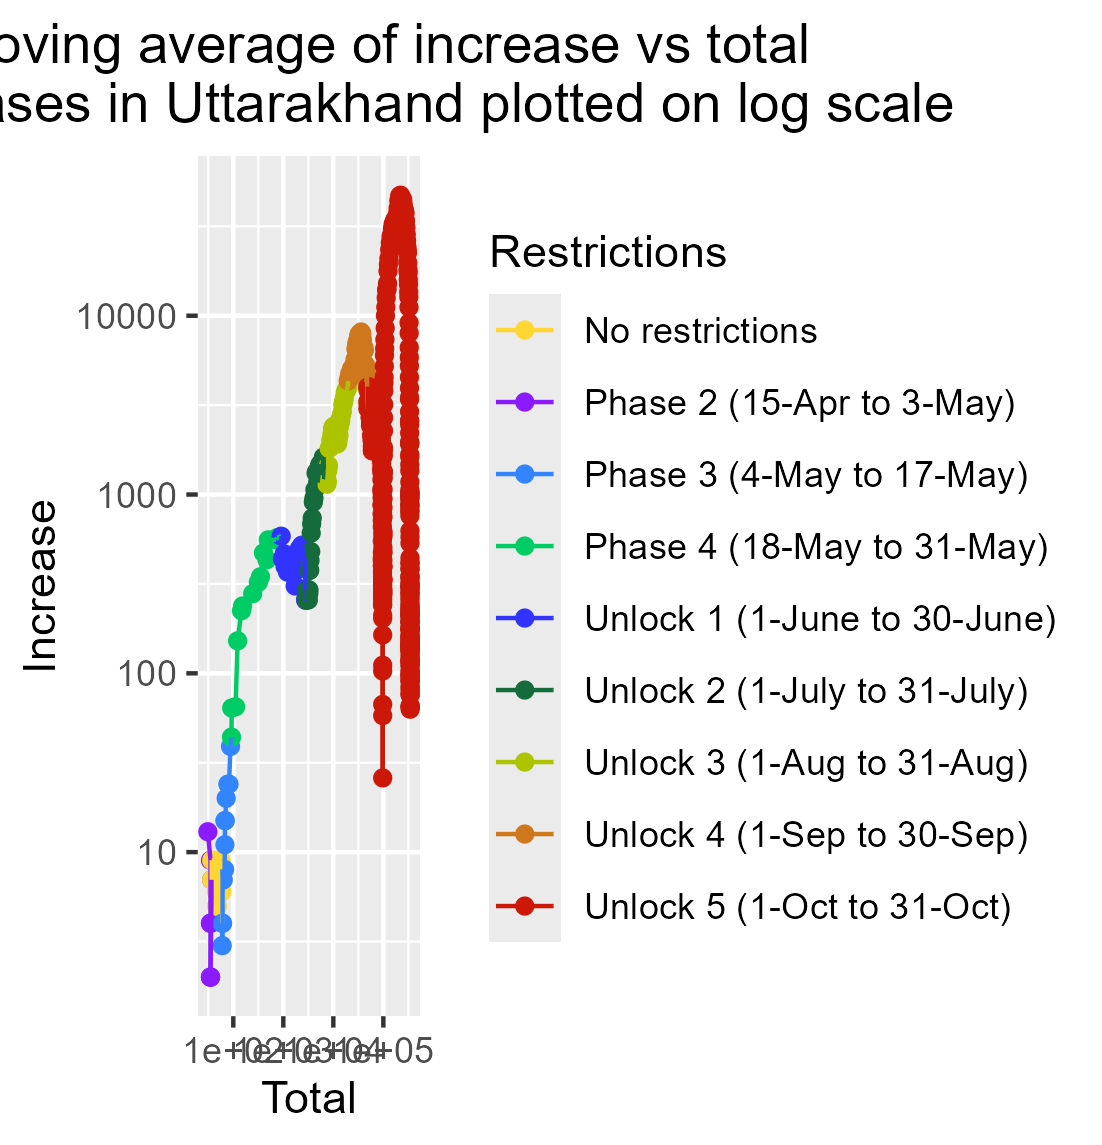
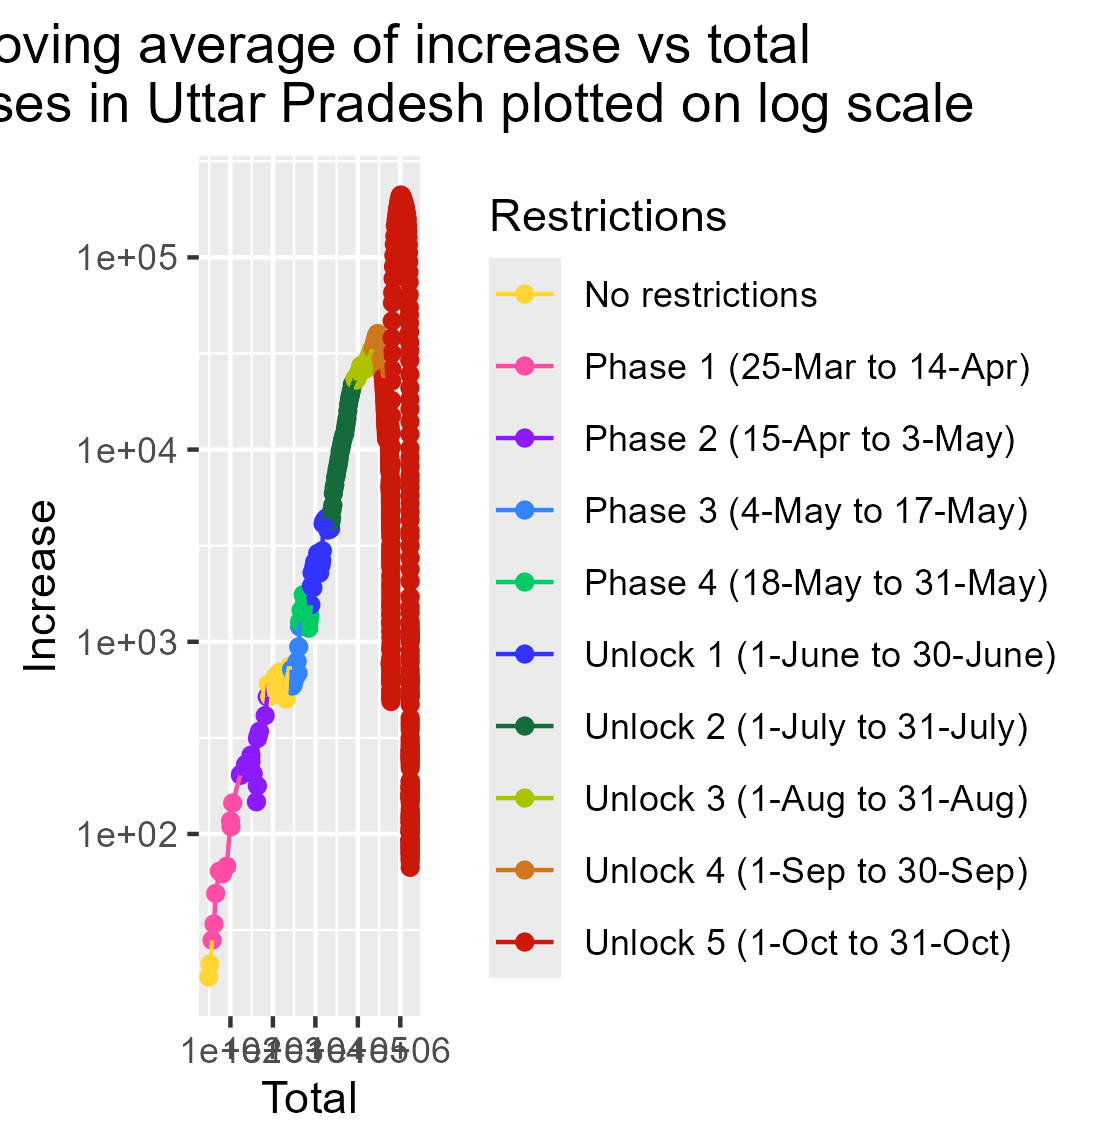
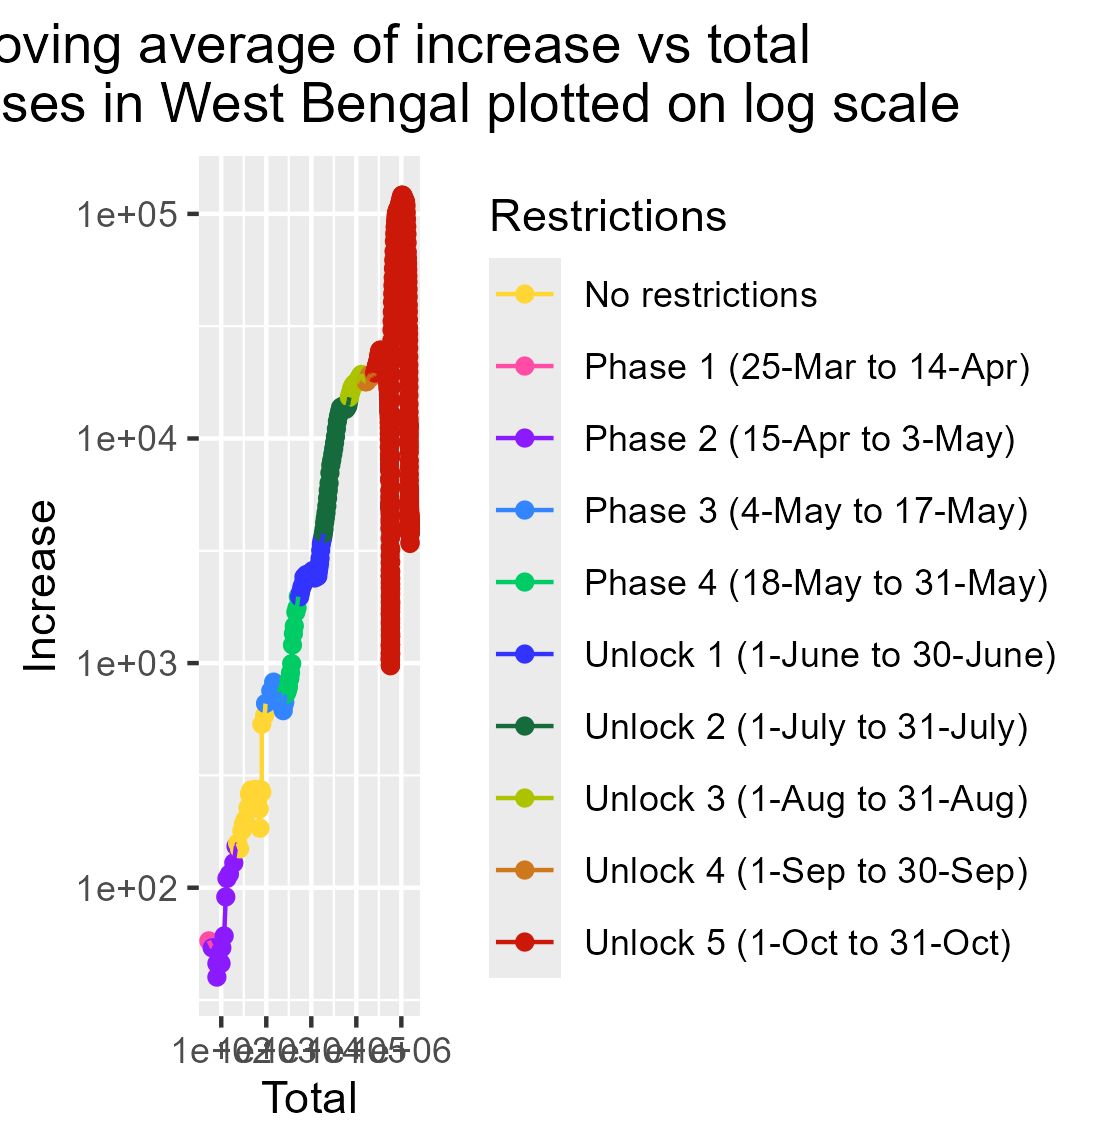
State wise Falling of Exponential
The "Falling of Exponential Growth for States in India" plot depicts the relationship between the 7-day moving average of case increases and the total number of cases in each state. The x-axis represents the 7-day moving average of new COVID-19 cases, providing a smoothed view of recent trends. The y-axis shows the total number of cases in each state.