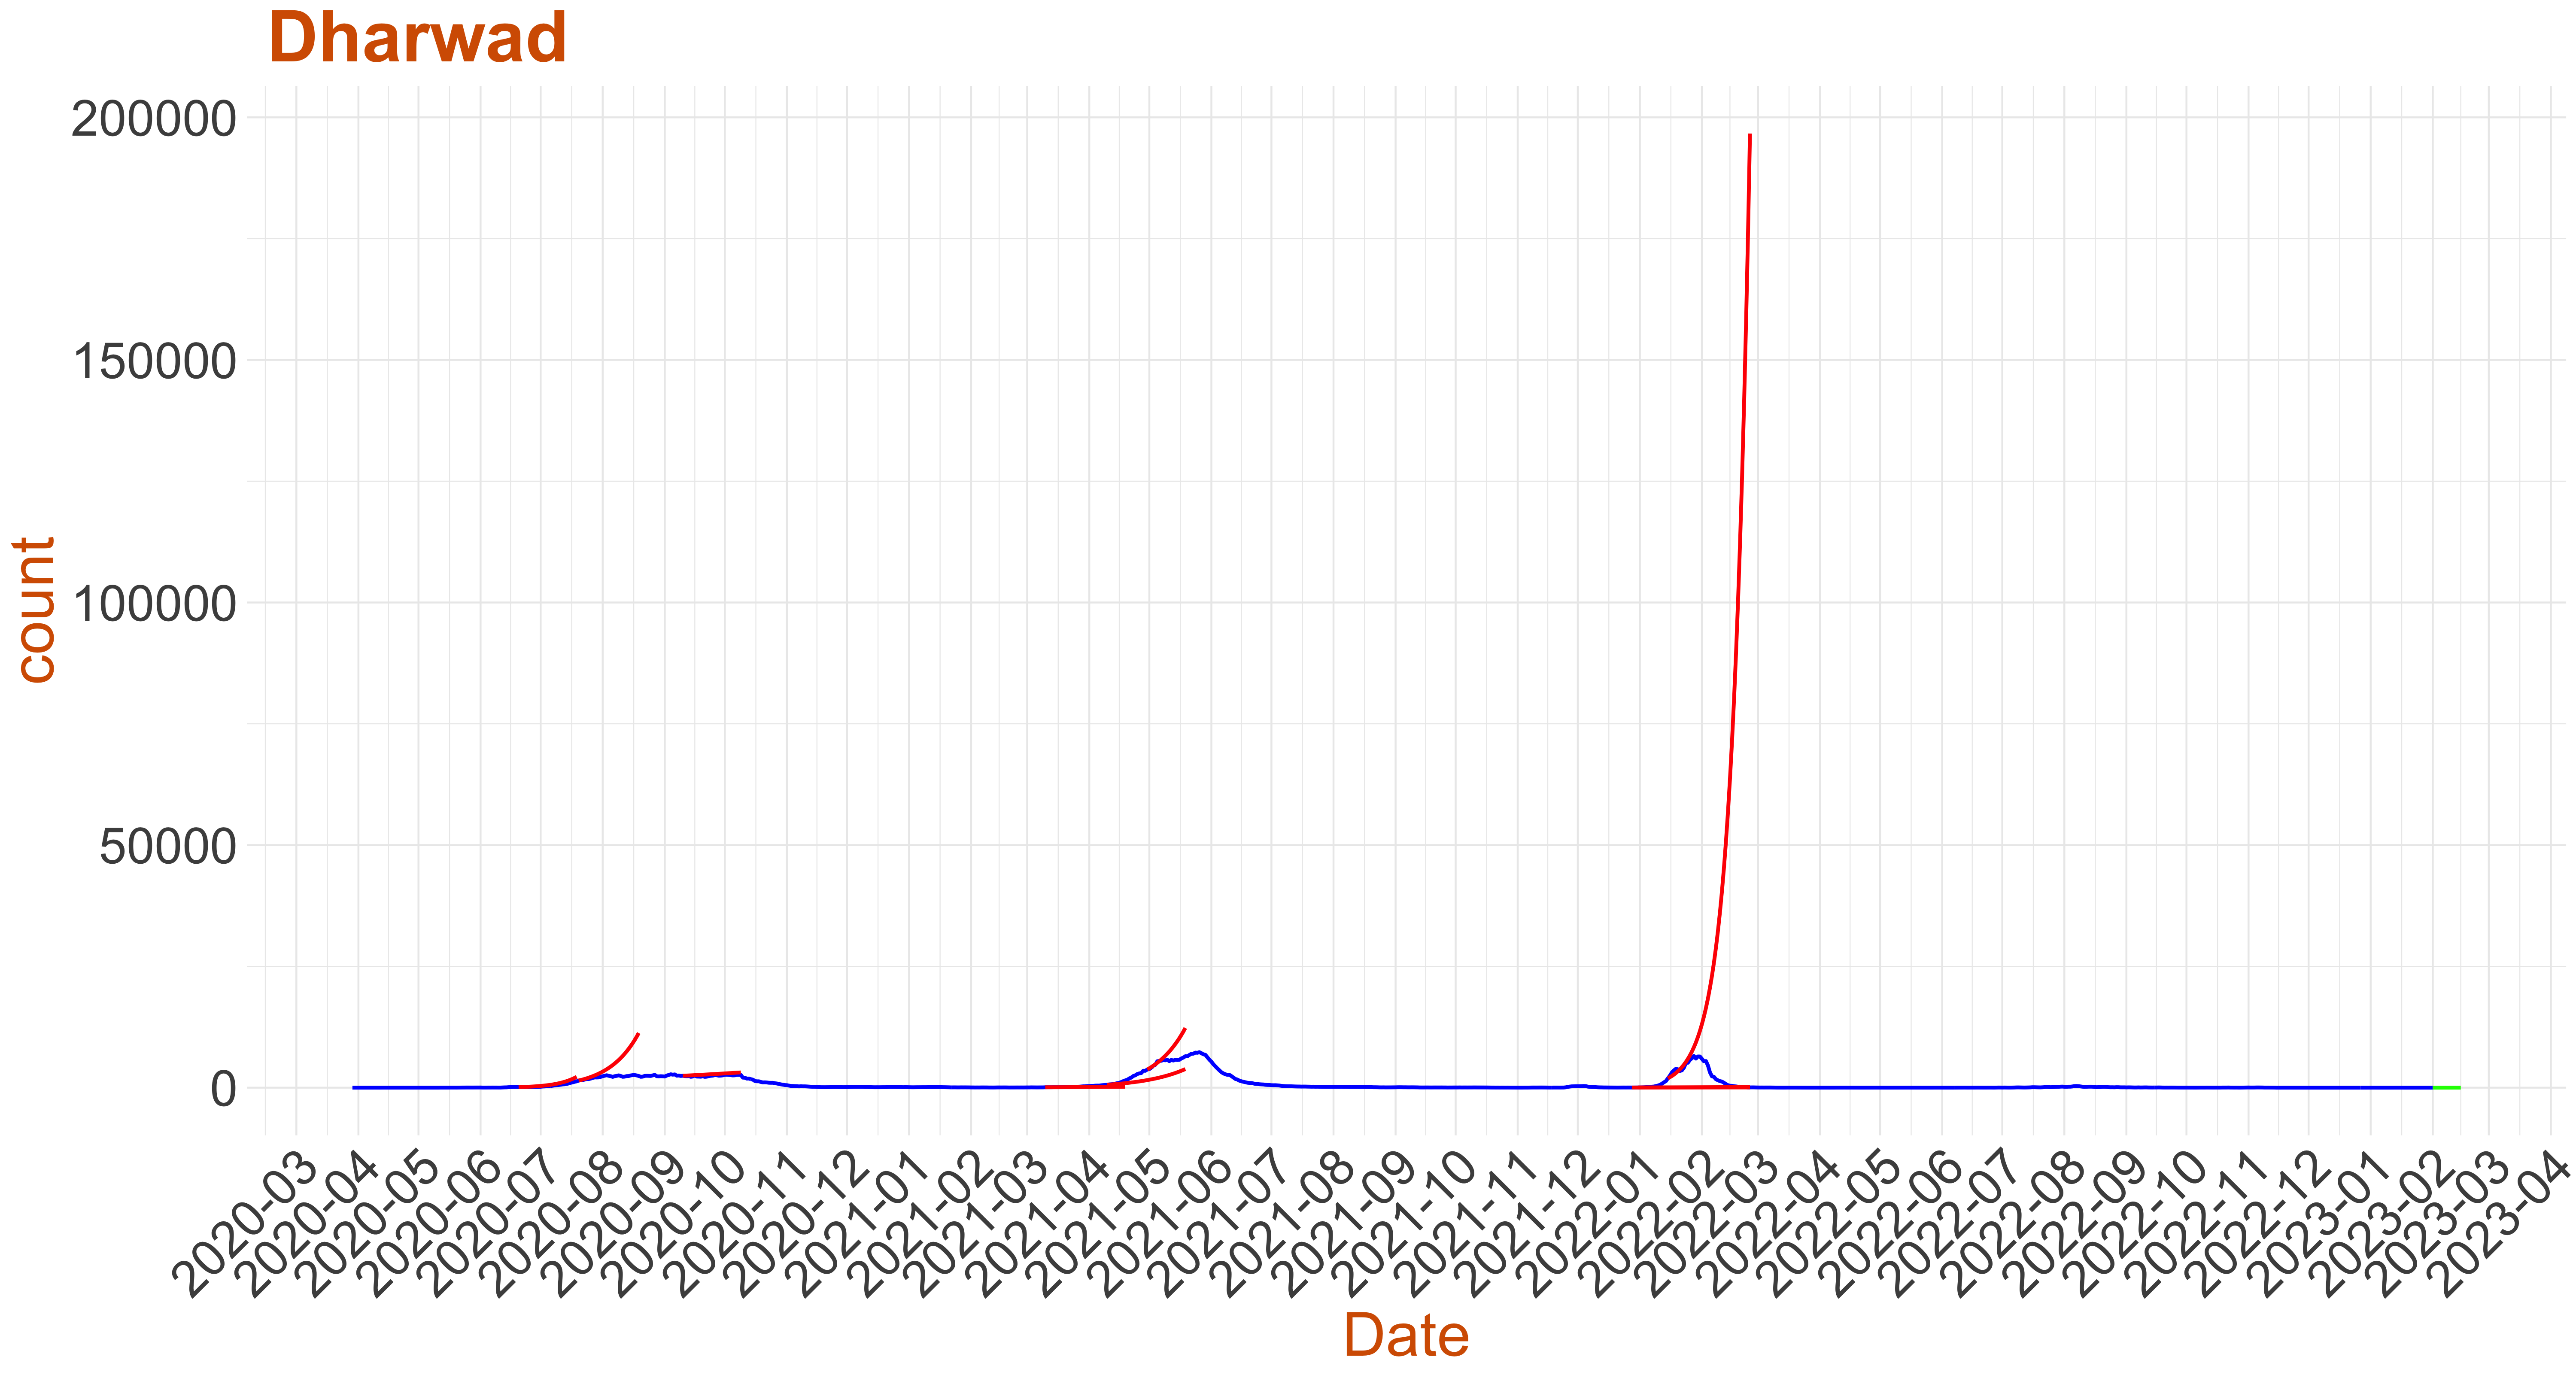
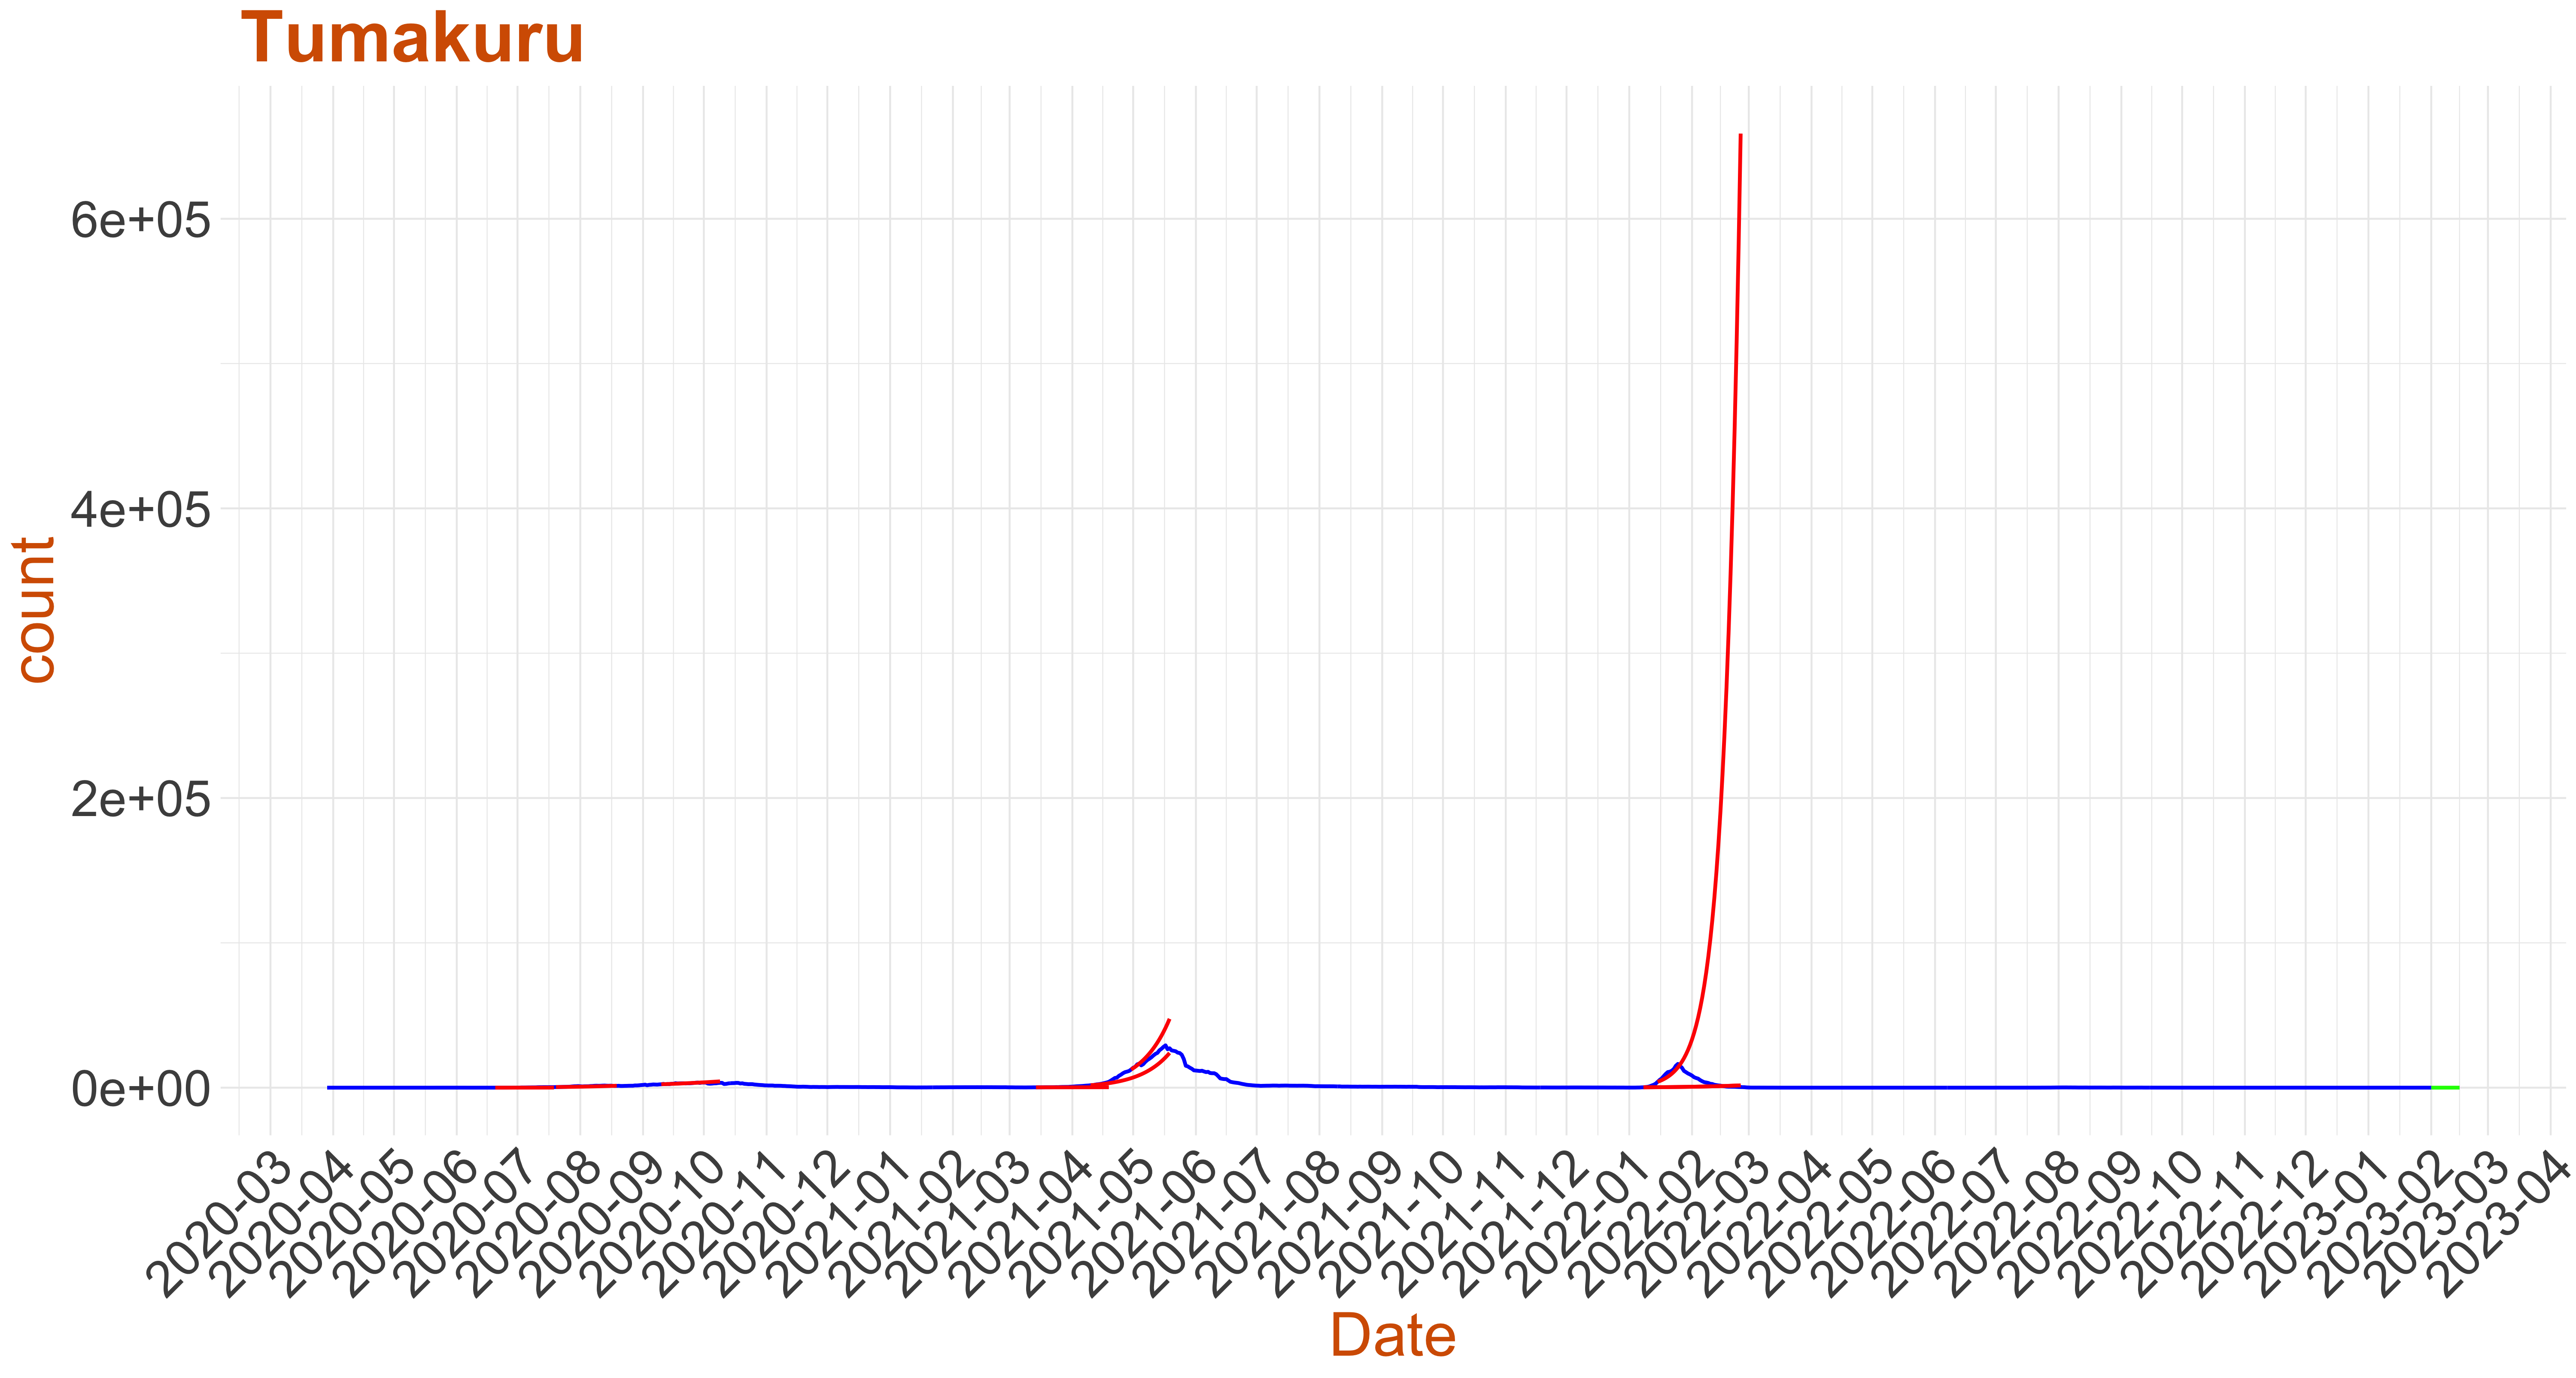
Category 1: Predicted Days to 1500 Active cases per million population is less than 100 days
Reproduction rate Rt of COVID-19 across different states in India. X axes represents timeline and Y axes represents mean or average reproduction rate Rt for each date. Hover on the image to see the annotation options like wiew Plotly file, download the plot, see R or CSV file.