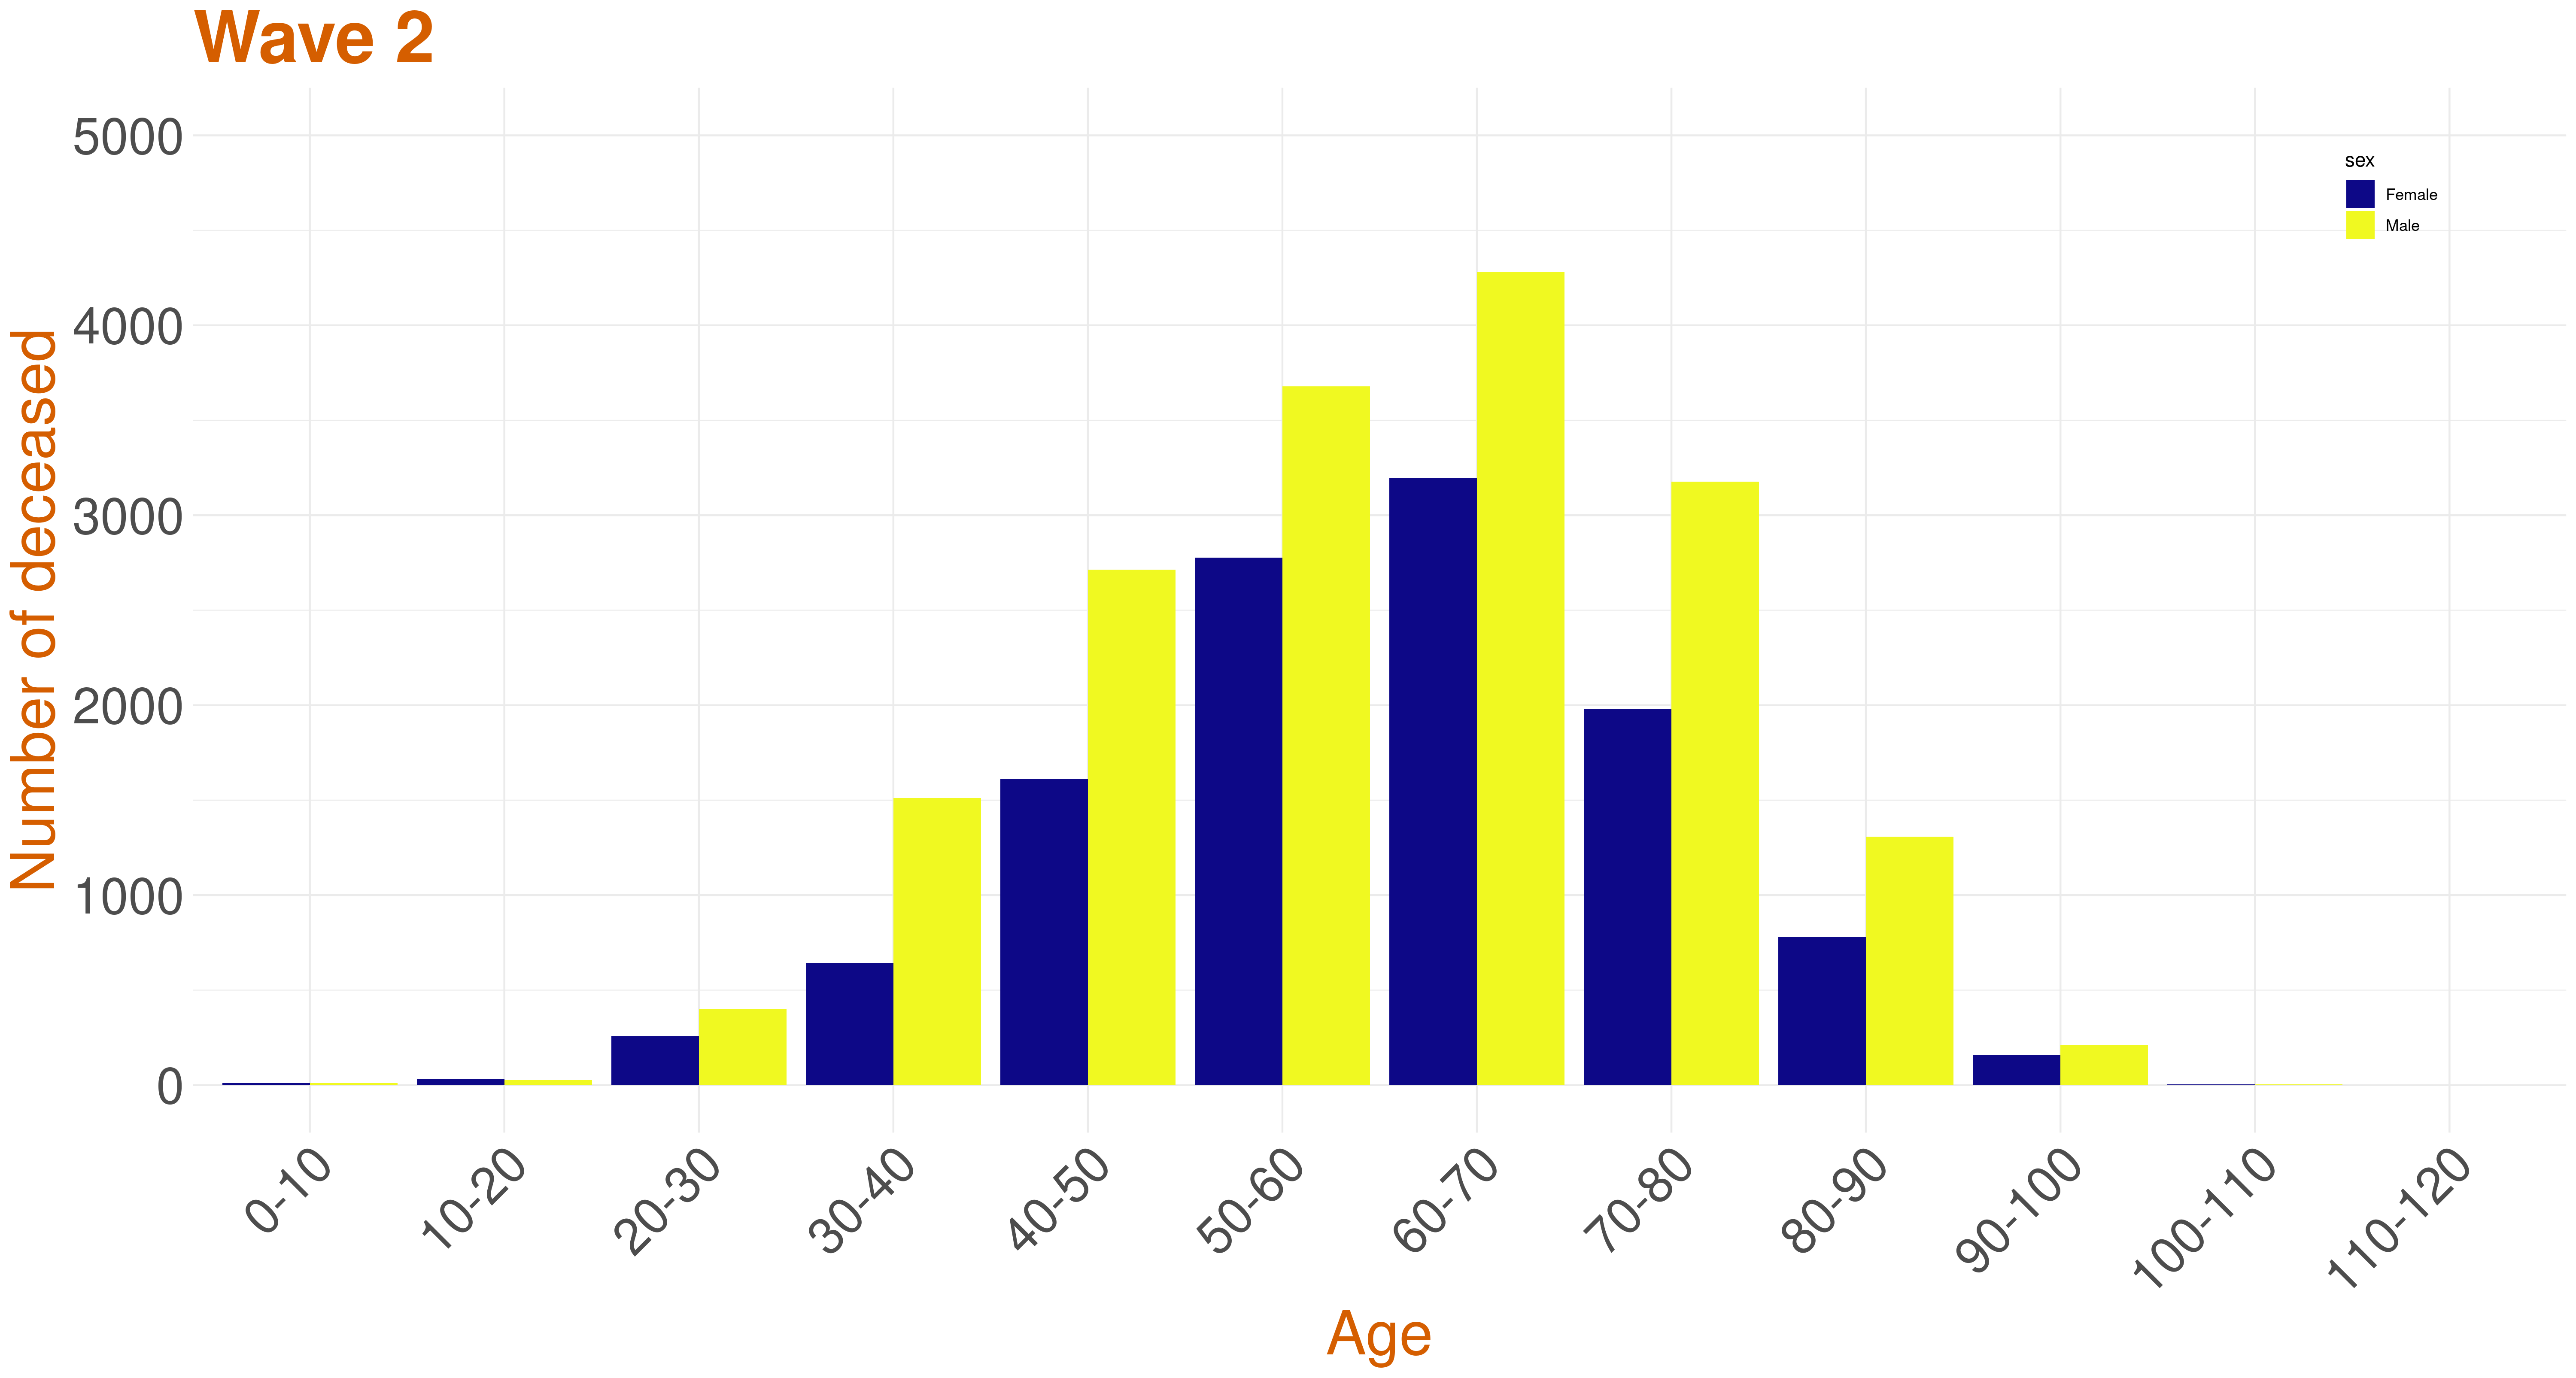
For all the graphs on this page, if you click on the image then it will display an interactive graph, where as you hover your mouse pointer over the graph annotations with details will be displayed.


Karnataka Deceased Data-Wave-wise Analysis

Karnataka State Government's Ministry of Health and Family Welfare has a dedicated COVID-19 Dashboard on its website and also has been providing detailed Media Bulletins on a daily basis since March 9th, 2020. In this page, we track the Deceased data provided in bulletins to give a more comprehensive view of the COVID-19 fatalities in the state of Karnataka. In particular we track:

The data collected has been classified into three waves to get a better understanding of the impact of Covid-19.

  • Wave 1 - till the end of October 2020
  • Middle wave - from November 2020 till the end of January 2021
  • Wave 2 - from February 2021 till present

Since,the counts during the Wave Middle were comparatively low,so,for some of the plots,we only considered Wave 1 and Wave 2 for our analysis.

  • Deaths across Waves


  • Age-Distribution across Waves


  • Age-Gender-Distribution across Waves


  • .


  • Days to decease across waves


  • Days to report across waves


  • Place of Death across waves