All Scatter plots for Deceased data analysis
The detailed anaysis of the deceased is done based on the age, gender, days to decease, days to report and the place of death.
Scatter plot for Days to Decease(KARNATAKA)
While plotting this, we took all districts except Bengaluru Urban.Since Bengaluru Urban had high number of death counts, so to have a better understanding among the other districts we left out Bengaluru urban and carried our analysis.

It is evident from the plot that in almost all the districts, fatalities were within 2 weeks.
Scatter plot for Days to Decease(KARNATAKA)
Scatter plot for all the districts are done here in the following plot.

It is evident that Bengaluru Urban is unique because it had high number of death counts.Here to the point are dense very early in the x-axis implying that fatalities were mostly within 2-weeks.
Scatter plot for Days to Decease Age-wise

Scatter plot for Days to Report(KARNATAKA)
While plotting this, we took all districts except Bengaluru Urban.Since Bengaluru Urban had high number of death counts, so to have a better understanding among the other districts we left out Bengaluru urban and carried our analysis.

From the above plot we observe that in the points are very dense within day 7,i.e,most of the districts reported death within a week.
Scatter plot for Days to Report(KARNATAKA)
Scatter plot for all the districts are done.

Bengaluru Urban is different from the rest as it had high death counts.
Analysing Wave-Wise
The entire data collected has been analysed wave wise to get a better understanding of the impact of Covid-19 and the nature of victims.
- Wave 1 - till the end of October 2020
- Wave Middle -From Nov-2020 to Jan-2021
- Wave 2 - since the end of January 2021 till present
Since,the counts during the Wave Middle were comparatively low,so,we only considered Wave 1 and Wave 2 for our analysis..
Mean Scatter plot for Days to Decease(Wave-1 vs Wave-2)
The graph below represents the Mean scatter plot for days to decease(wave-wise) in Karnataka based on the data collected.First,the NA's,and Others in the district column were omitted, then the mean is calculated and plotted below.

.
Mean Scatter plot for Days to Report(Wave-1 vs Wave-2)
The graph below represents the Mean scatter plot for days to Report(wave-wise) in Karnataka based on the data collected.First,the NA's,and Others in the district column were omitted, then the mean is calculated and plotted below.

.
Scatter plot of District-wise Hospitalisation Rate.
The graph below represents the scatter plot of districts in Karnataka based on the data collected.Here we take the ratio of patients hospitalised(i.e,we take the counts of patients who were hospitalised and divide it by total number of death across districts) on one axis and plot a scatter plot with total deaths on the other.This gives us a understanding of how well hospitalisation is done in a particular district.

Most of the districts did well in hospitalising patients.Since most of the districts are above the .95 mark.
Scatter plot of Hospitalisation Rate(Wave 1 vs Wave 2).
The graph below represents the scatter plot of districts in Karnataka based on the data collected.Here we take the ratio of patients hospitalised wave-wise and then we plot a scatter plot with wave 1 ratio on one axis and wave 2 ratio on the other axis.

Most of the districts did well in hospitalising patients.Since most of the districts are above the .95 mark.
Scatter plot of District-wise Hospitalisation Rate(Subplots).
Now for a better analysis we clustered individual districts on the basis of total death counts and then we again perform the similar analysis as earlier.Here we took 3 categories.Firstly with total death count less than 500,secondly total death count ranging within 500 to 1500,and thirdly districts with death count higher than 1500.


Wave 1 and Wave 2 number of deceased comparison
Number of deceased across districts and waves
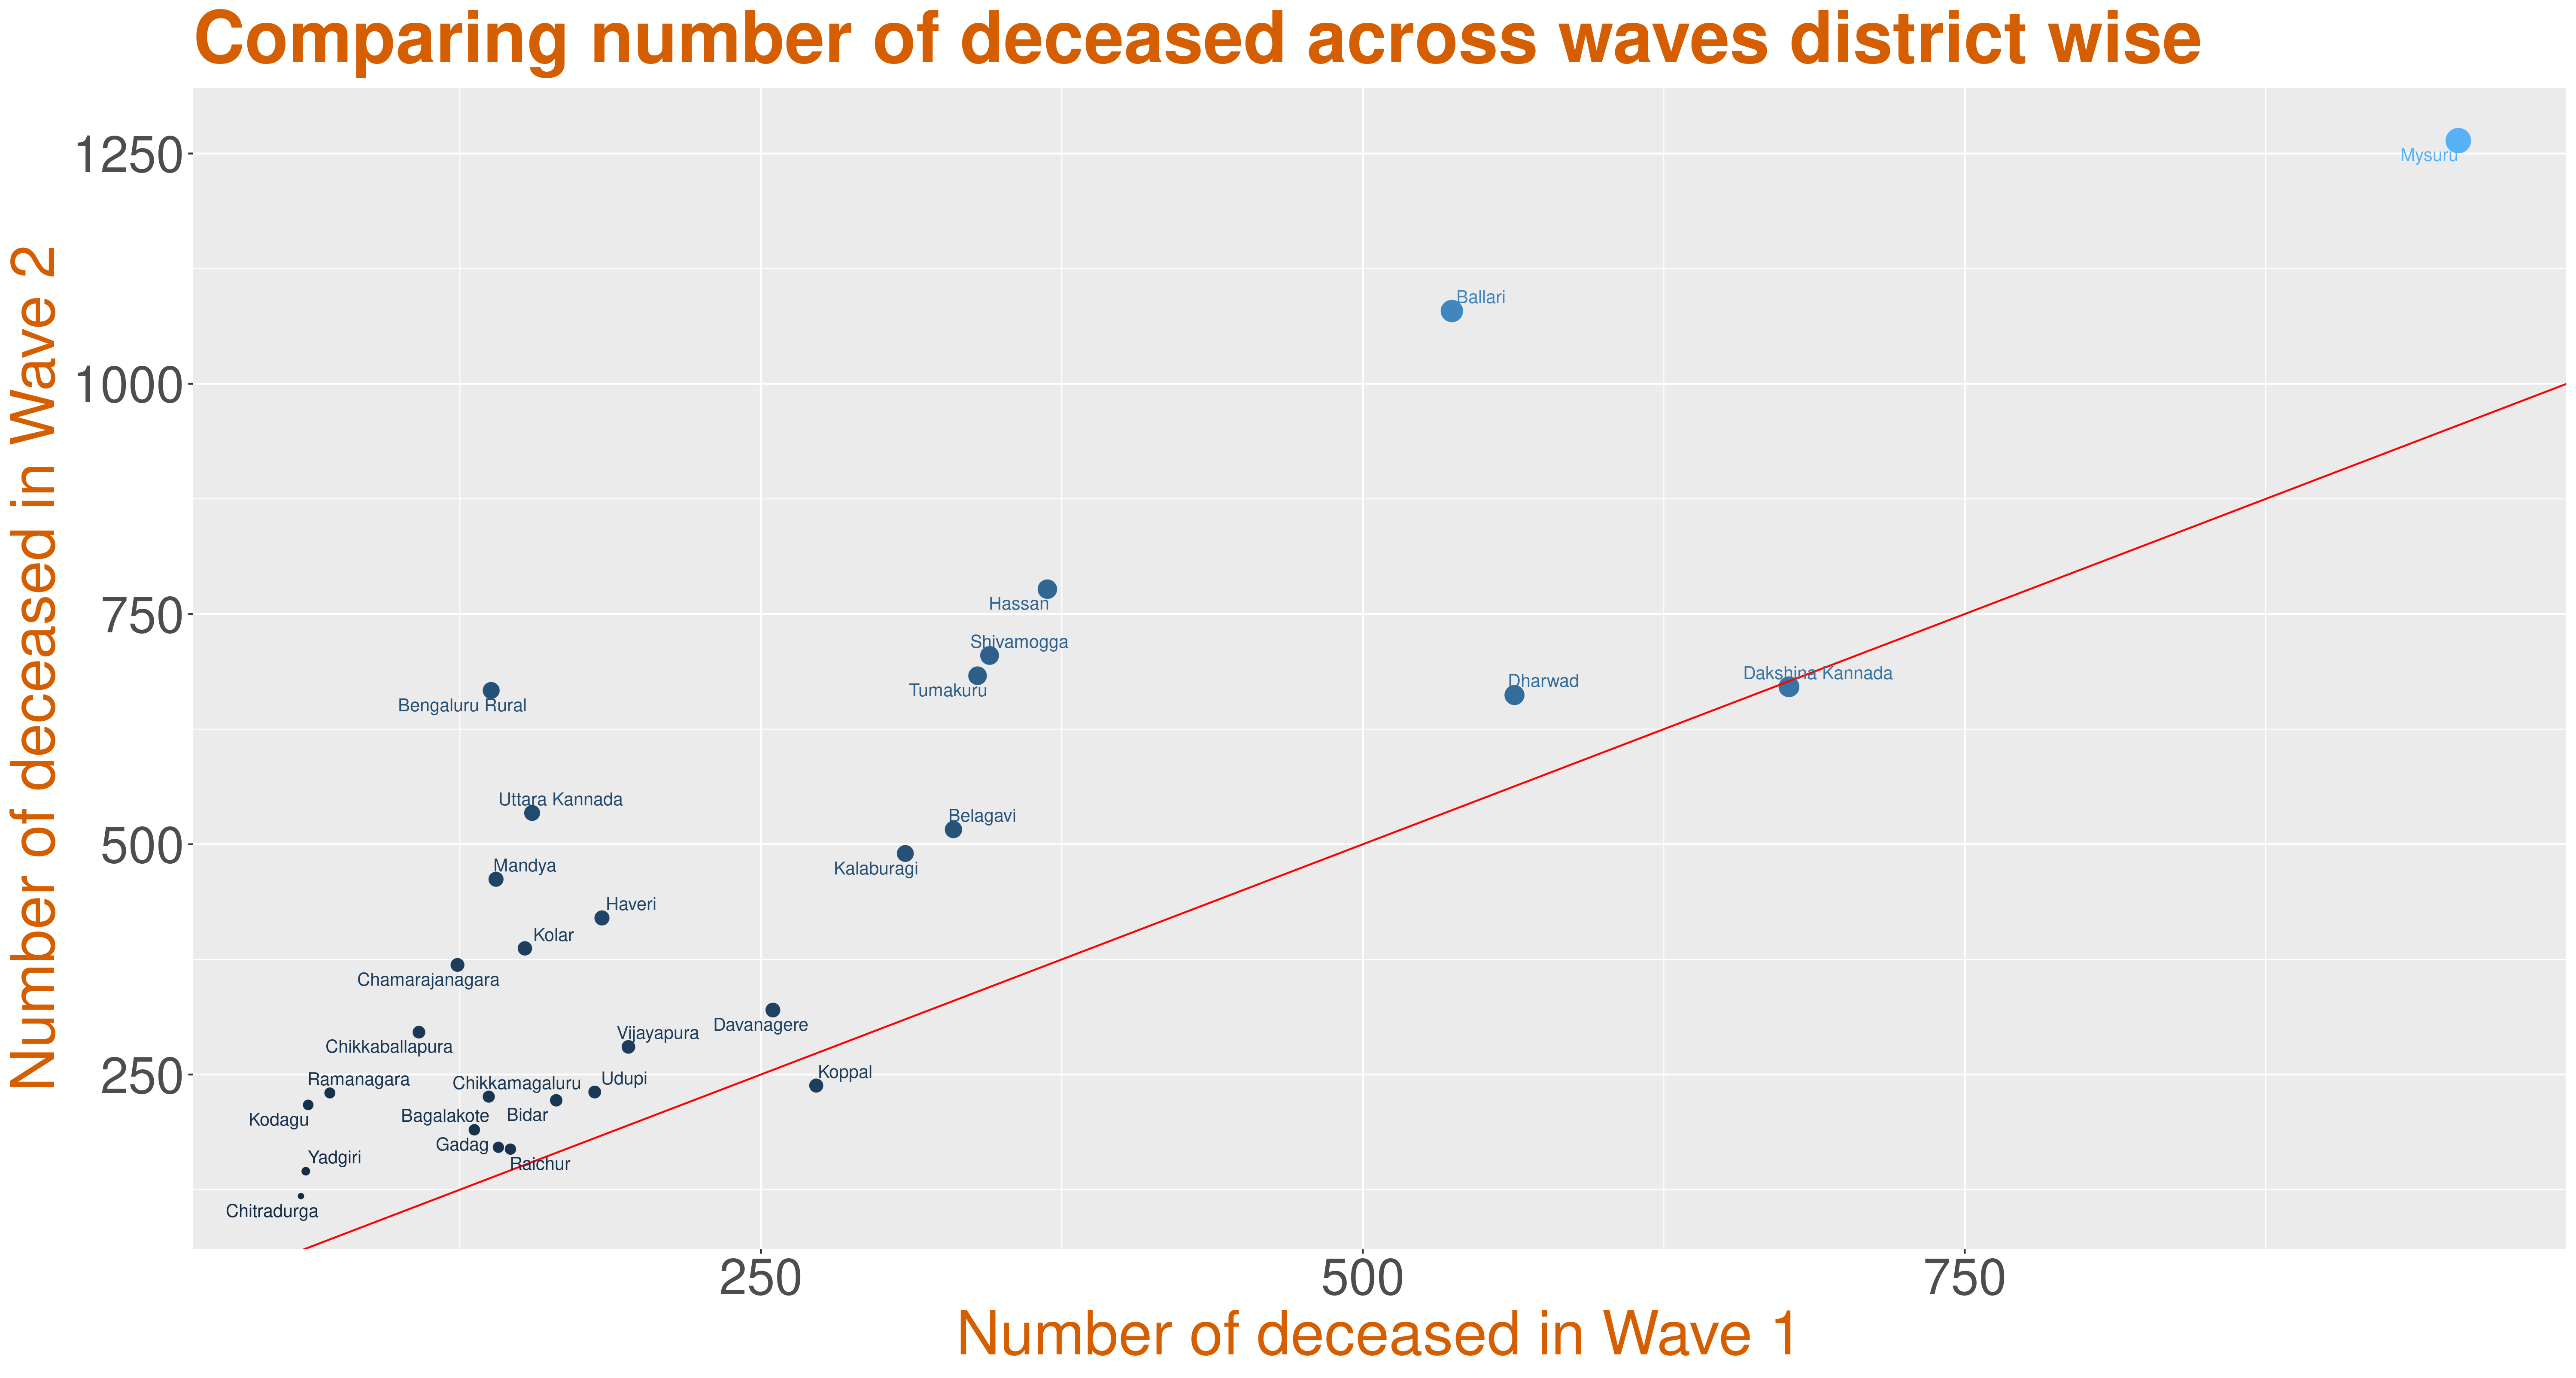
This is a plot of number of deceased in wave 1 versus the number of deceased in wave 2, with the point size indicating the sum of deaths during the two waves across districts. The line y=x has been plotted. This suggests that the districts above the line have wave 2 death count higher than wave 1 death count, while districts below the line have wave 1 death count higher than that of wave 2. The number of deceased in Bengaluru Urban during wave 1 is 3836, during middle wave is 488 and during wave 2 is 11235 as of 2nd July, 2021. Due to the large count, this district (Bengaluru Urban) has not been plotted.
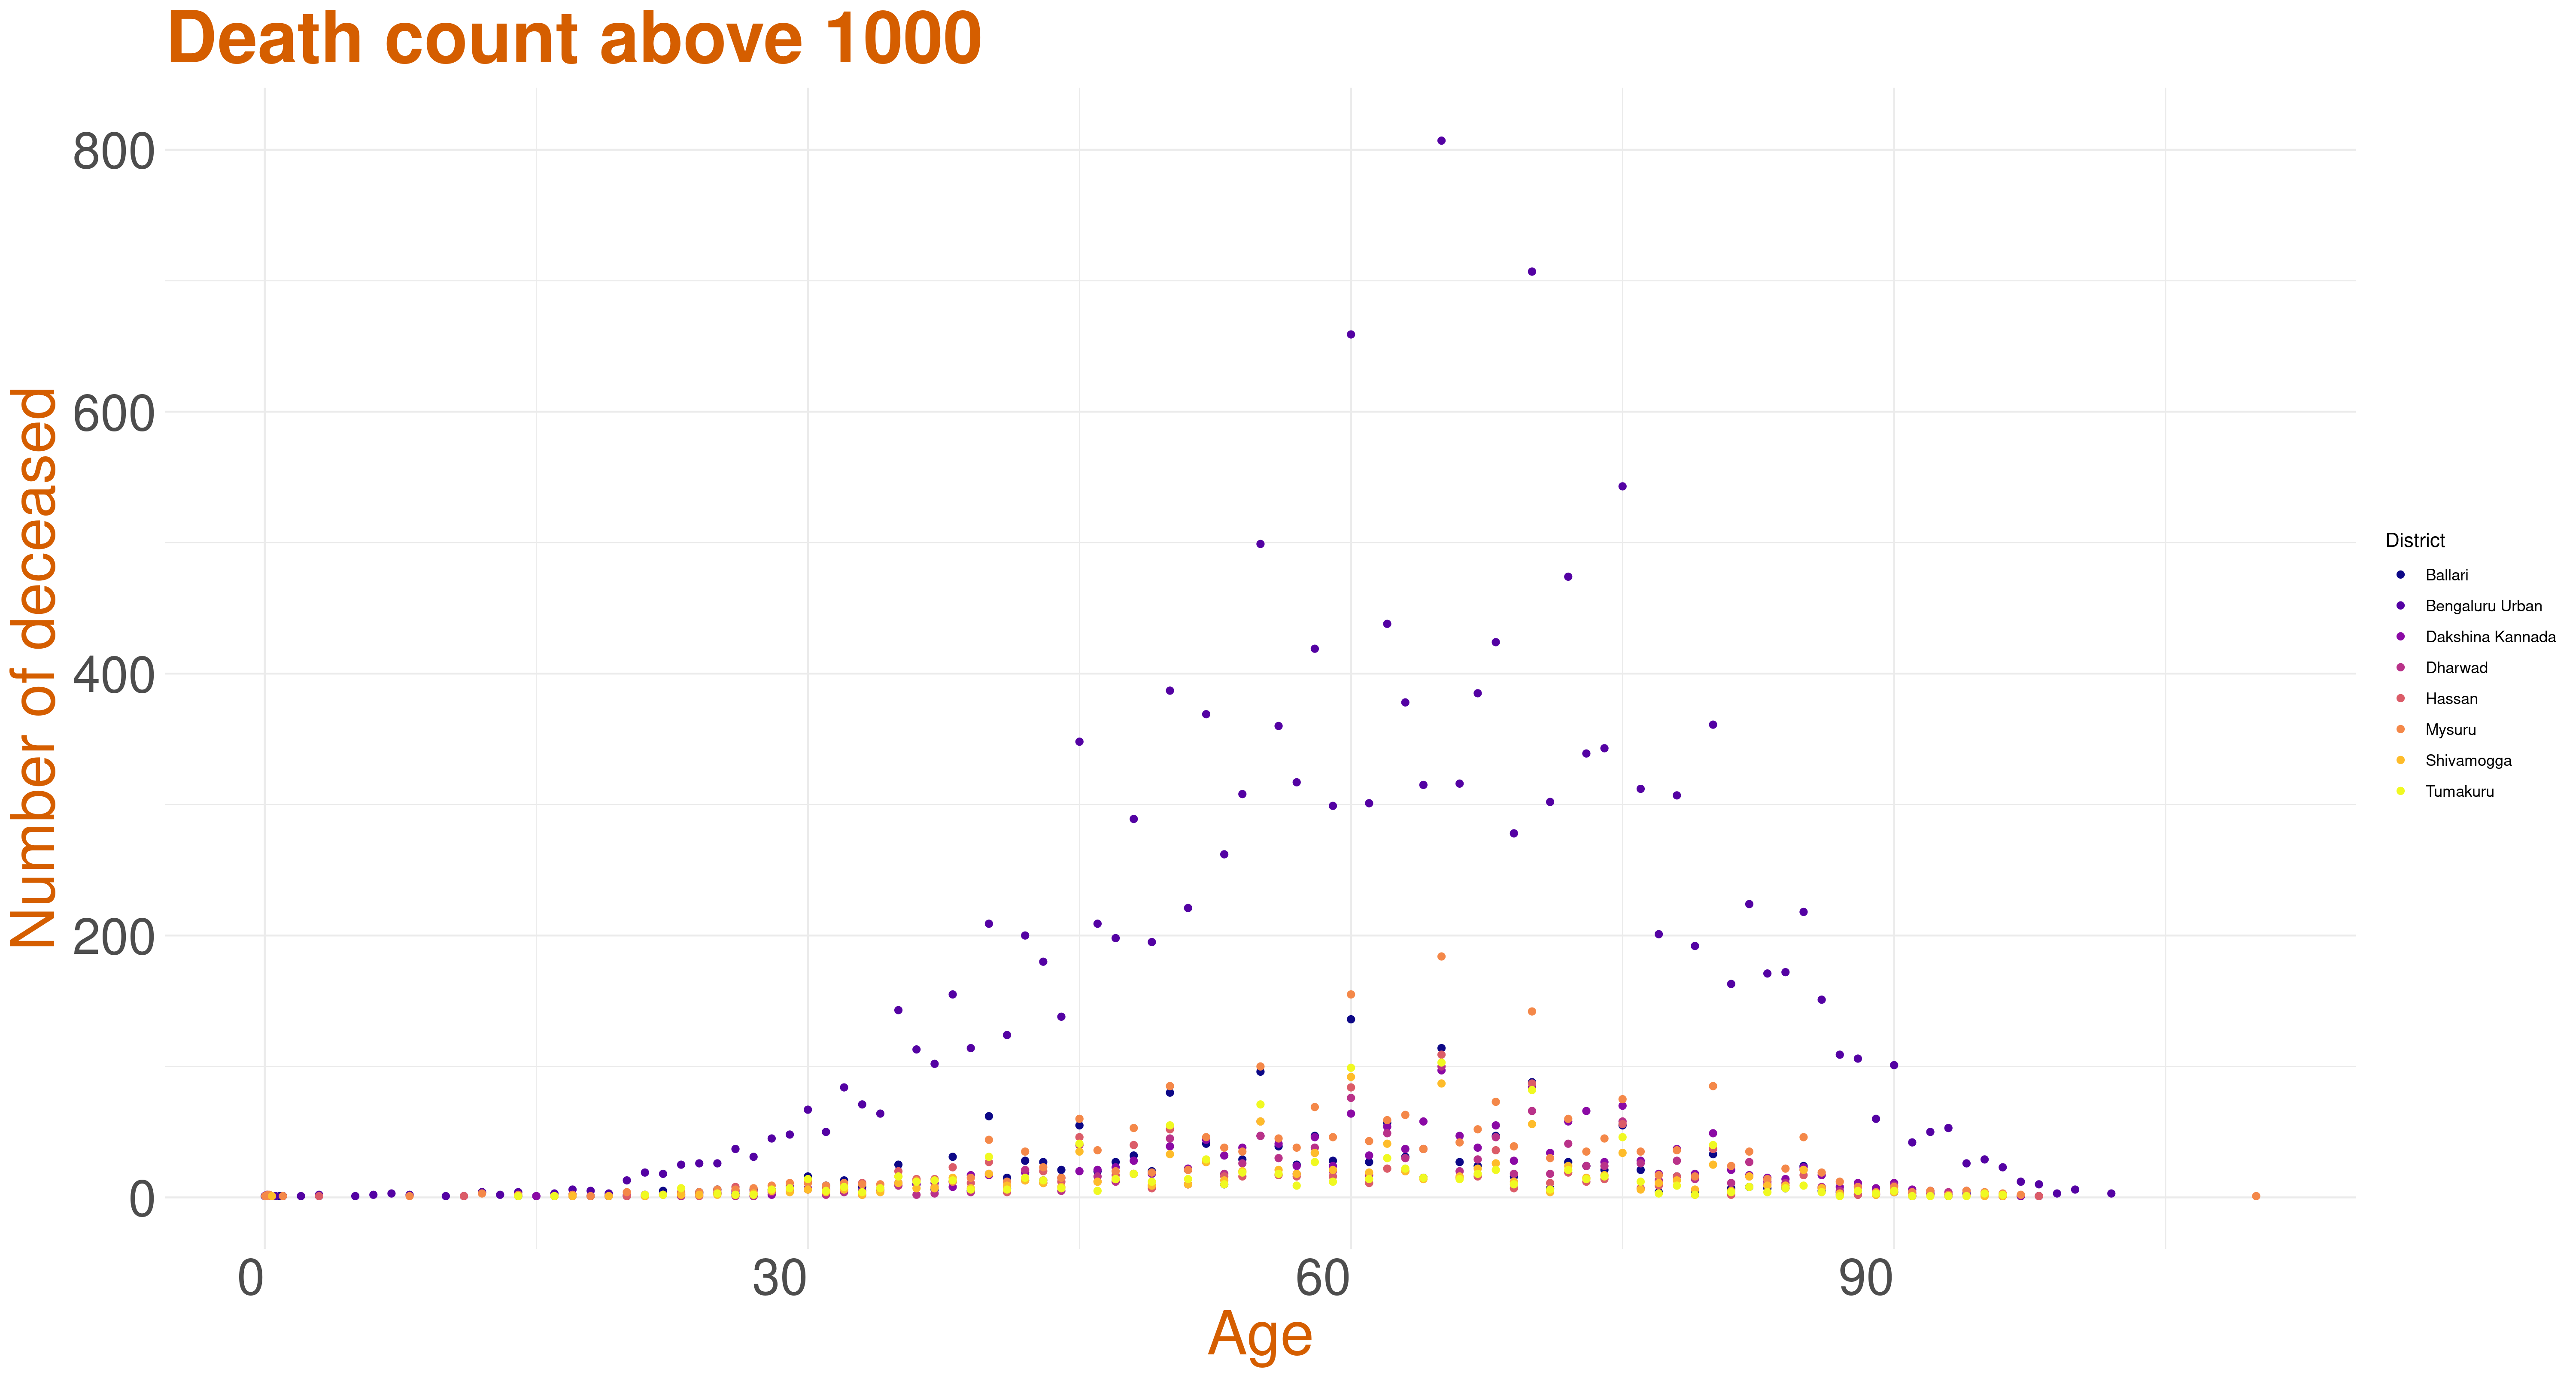
District based Age distribution
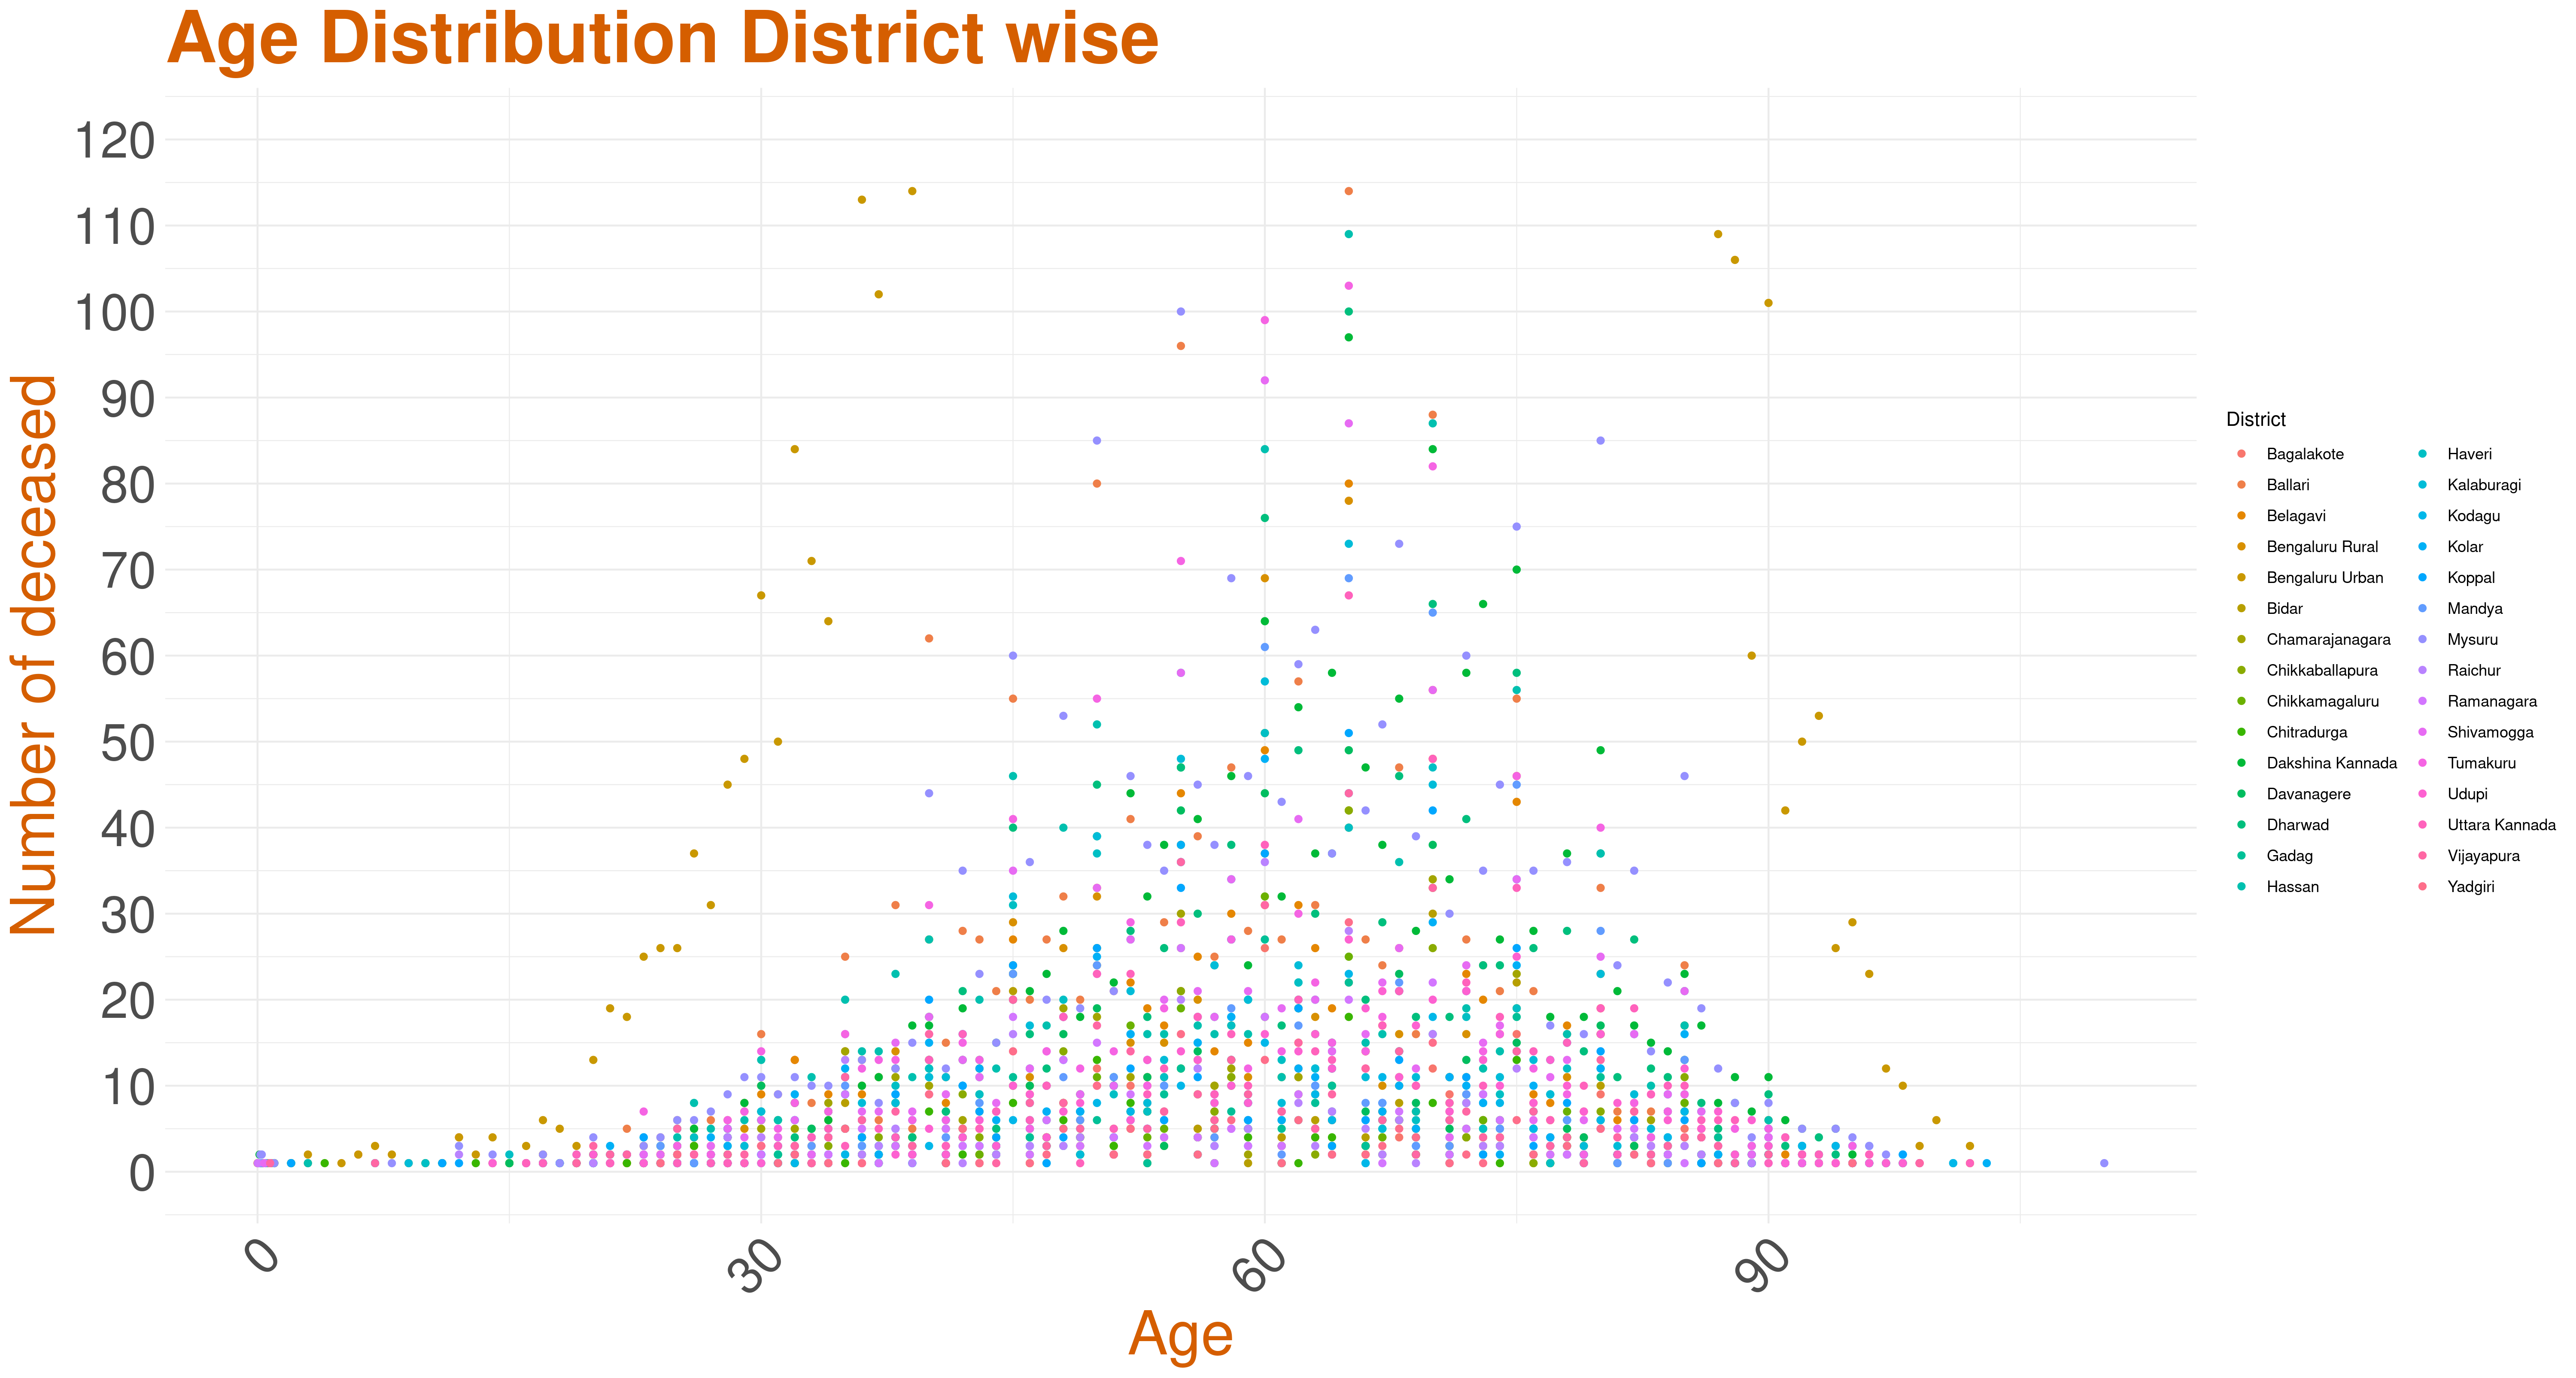
This graph is the scatter plot of the age data of the deceased across all districts. As we can see, Bengaluru Urban's trend seems to be different.
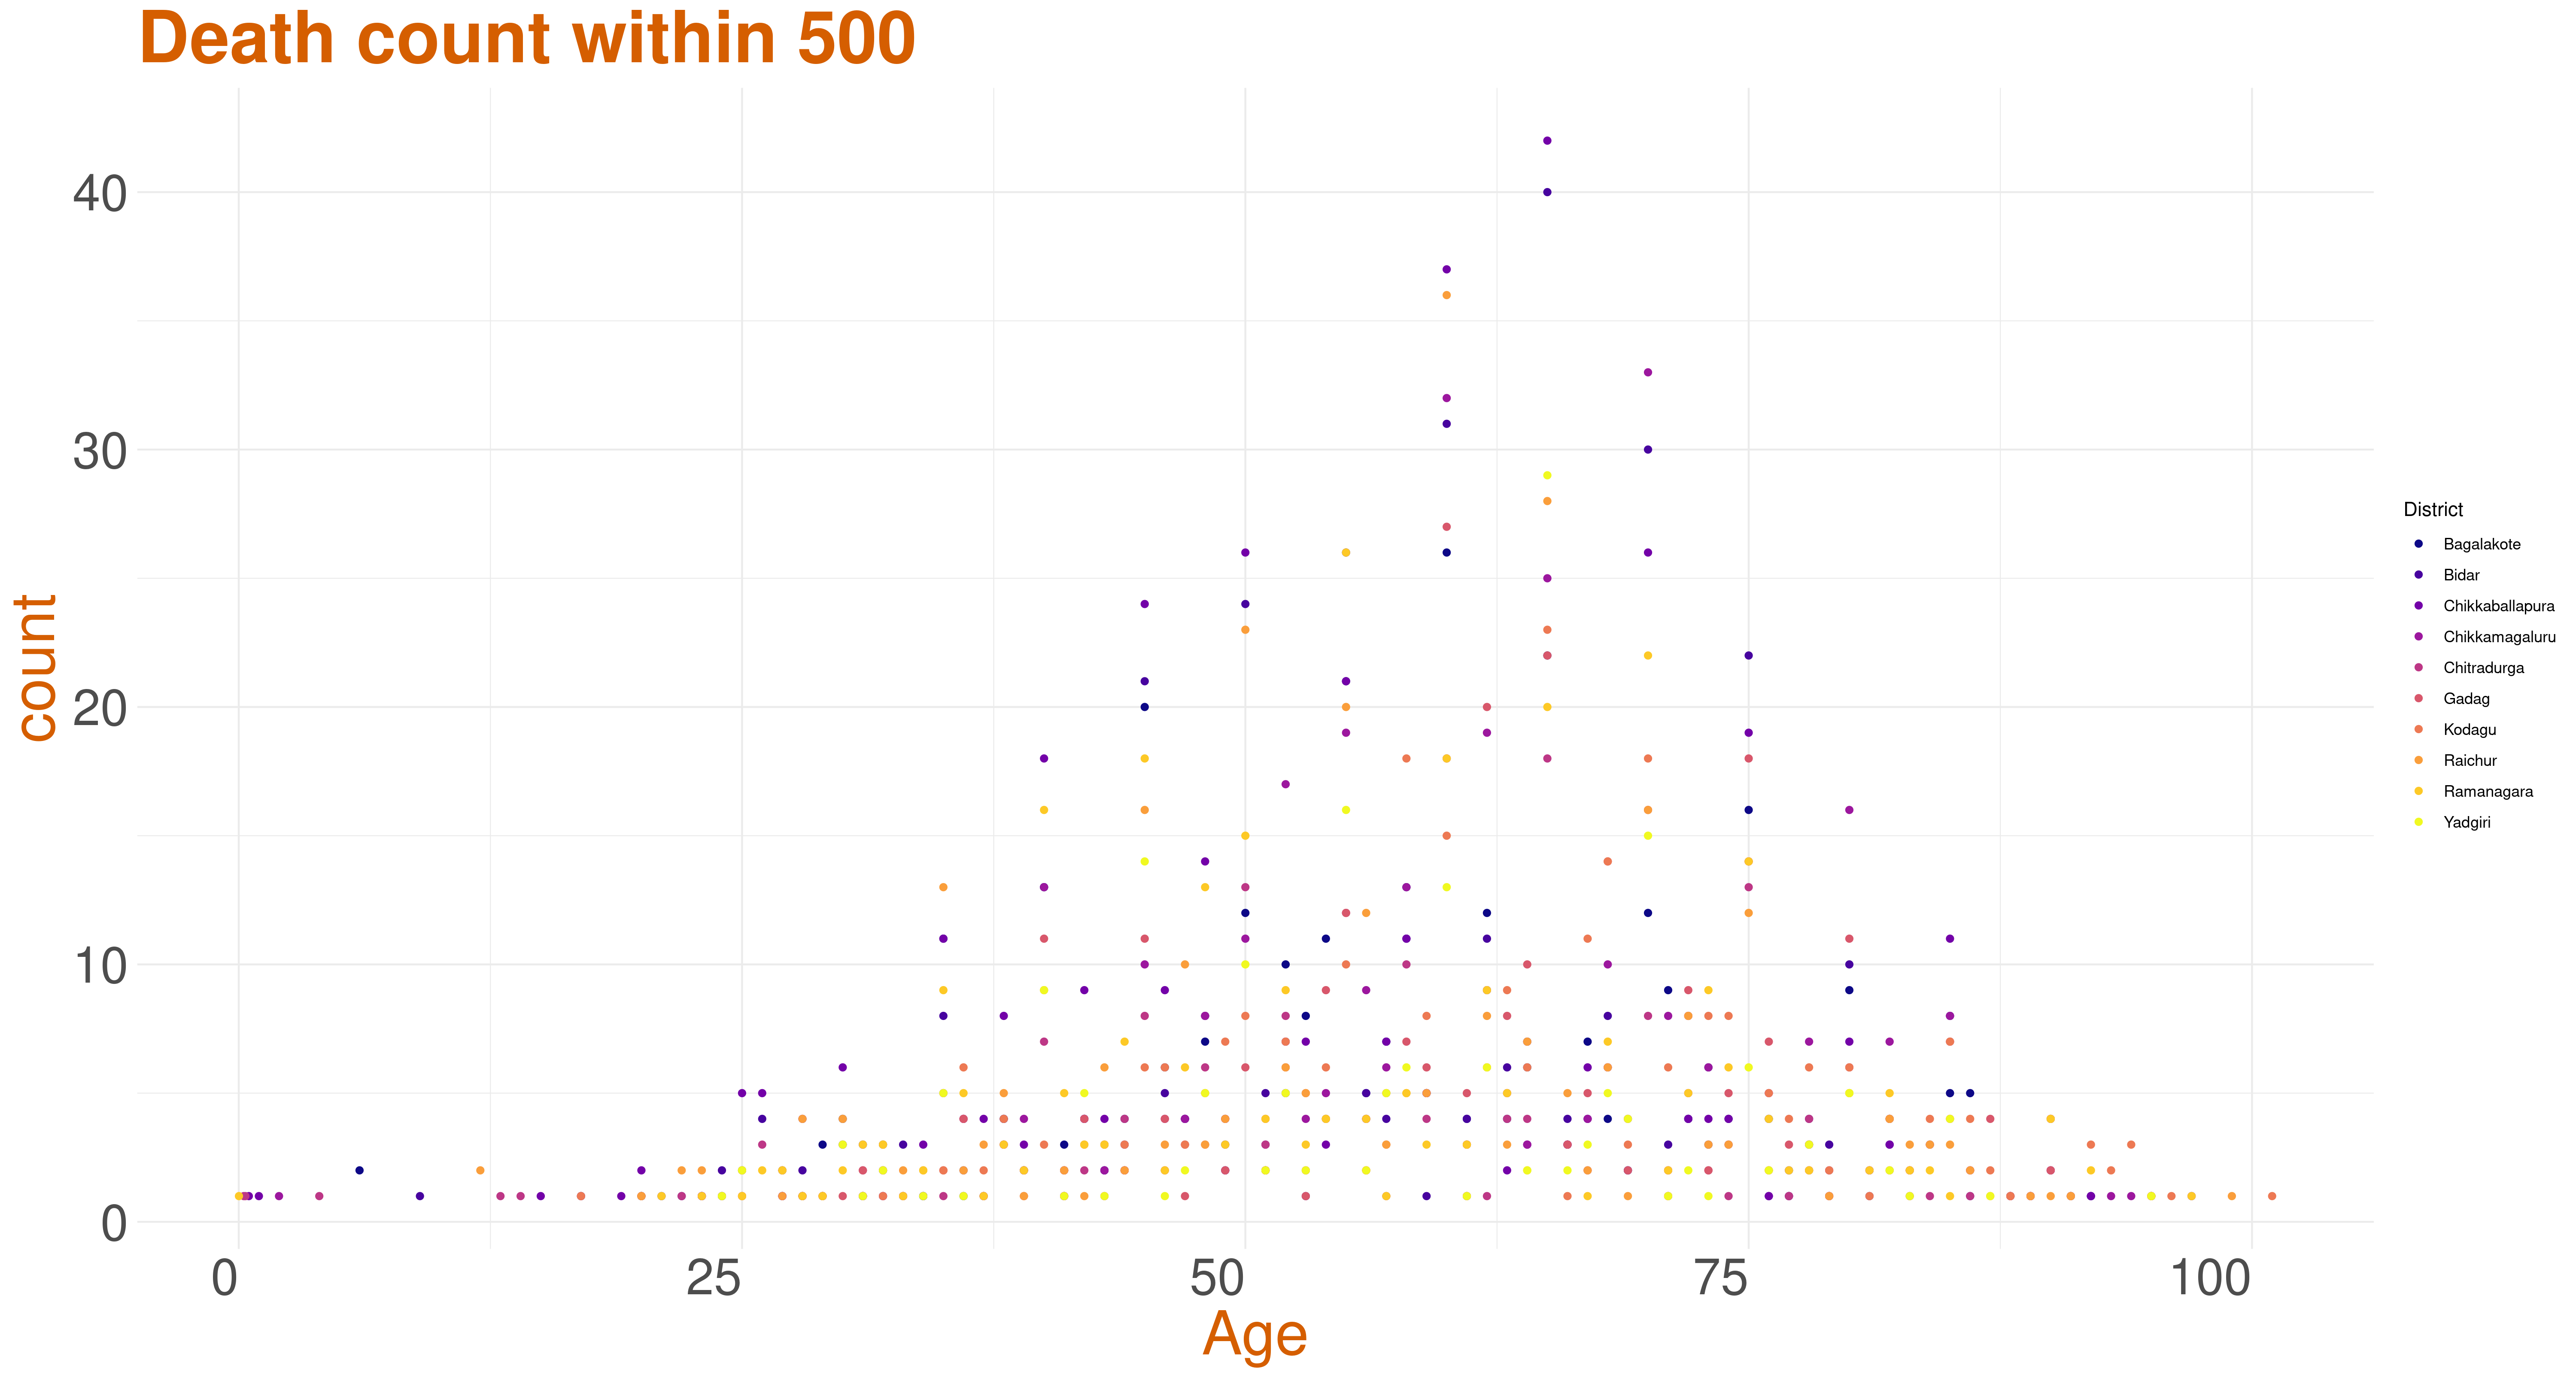
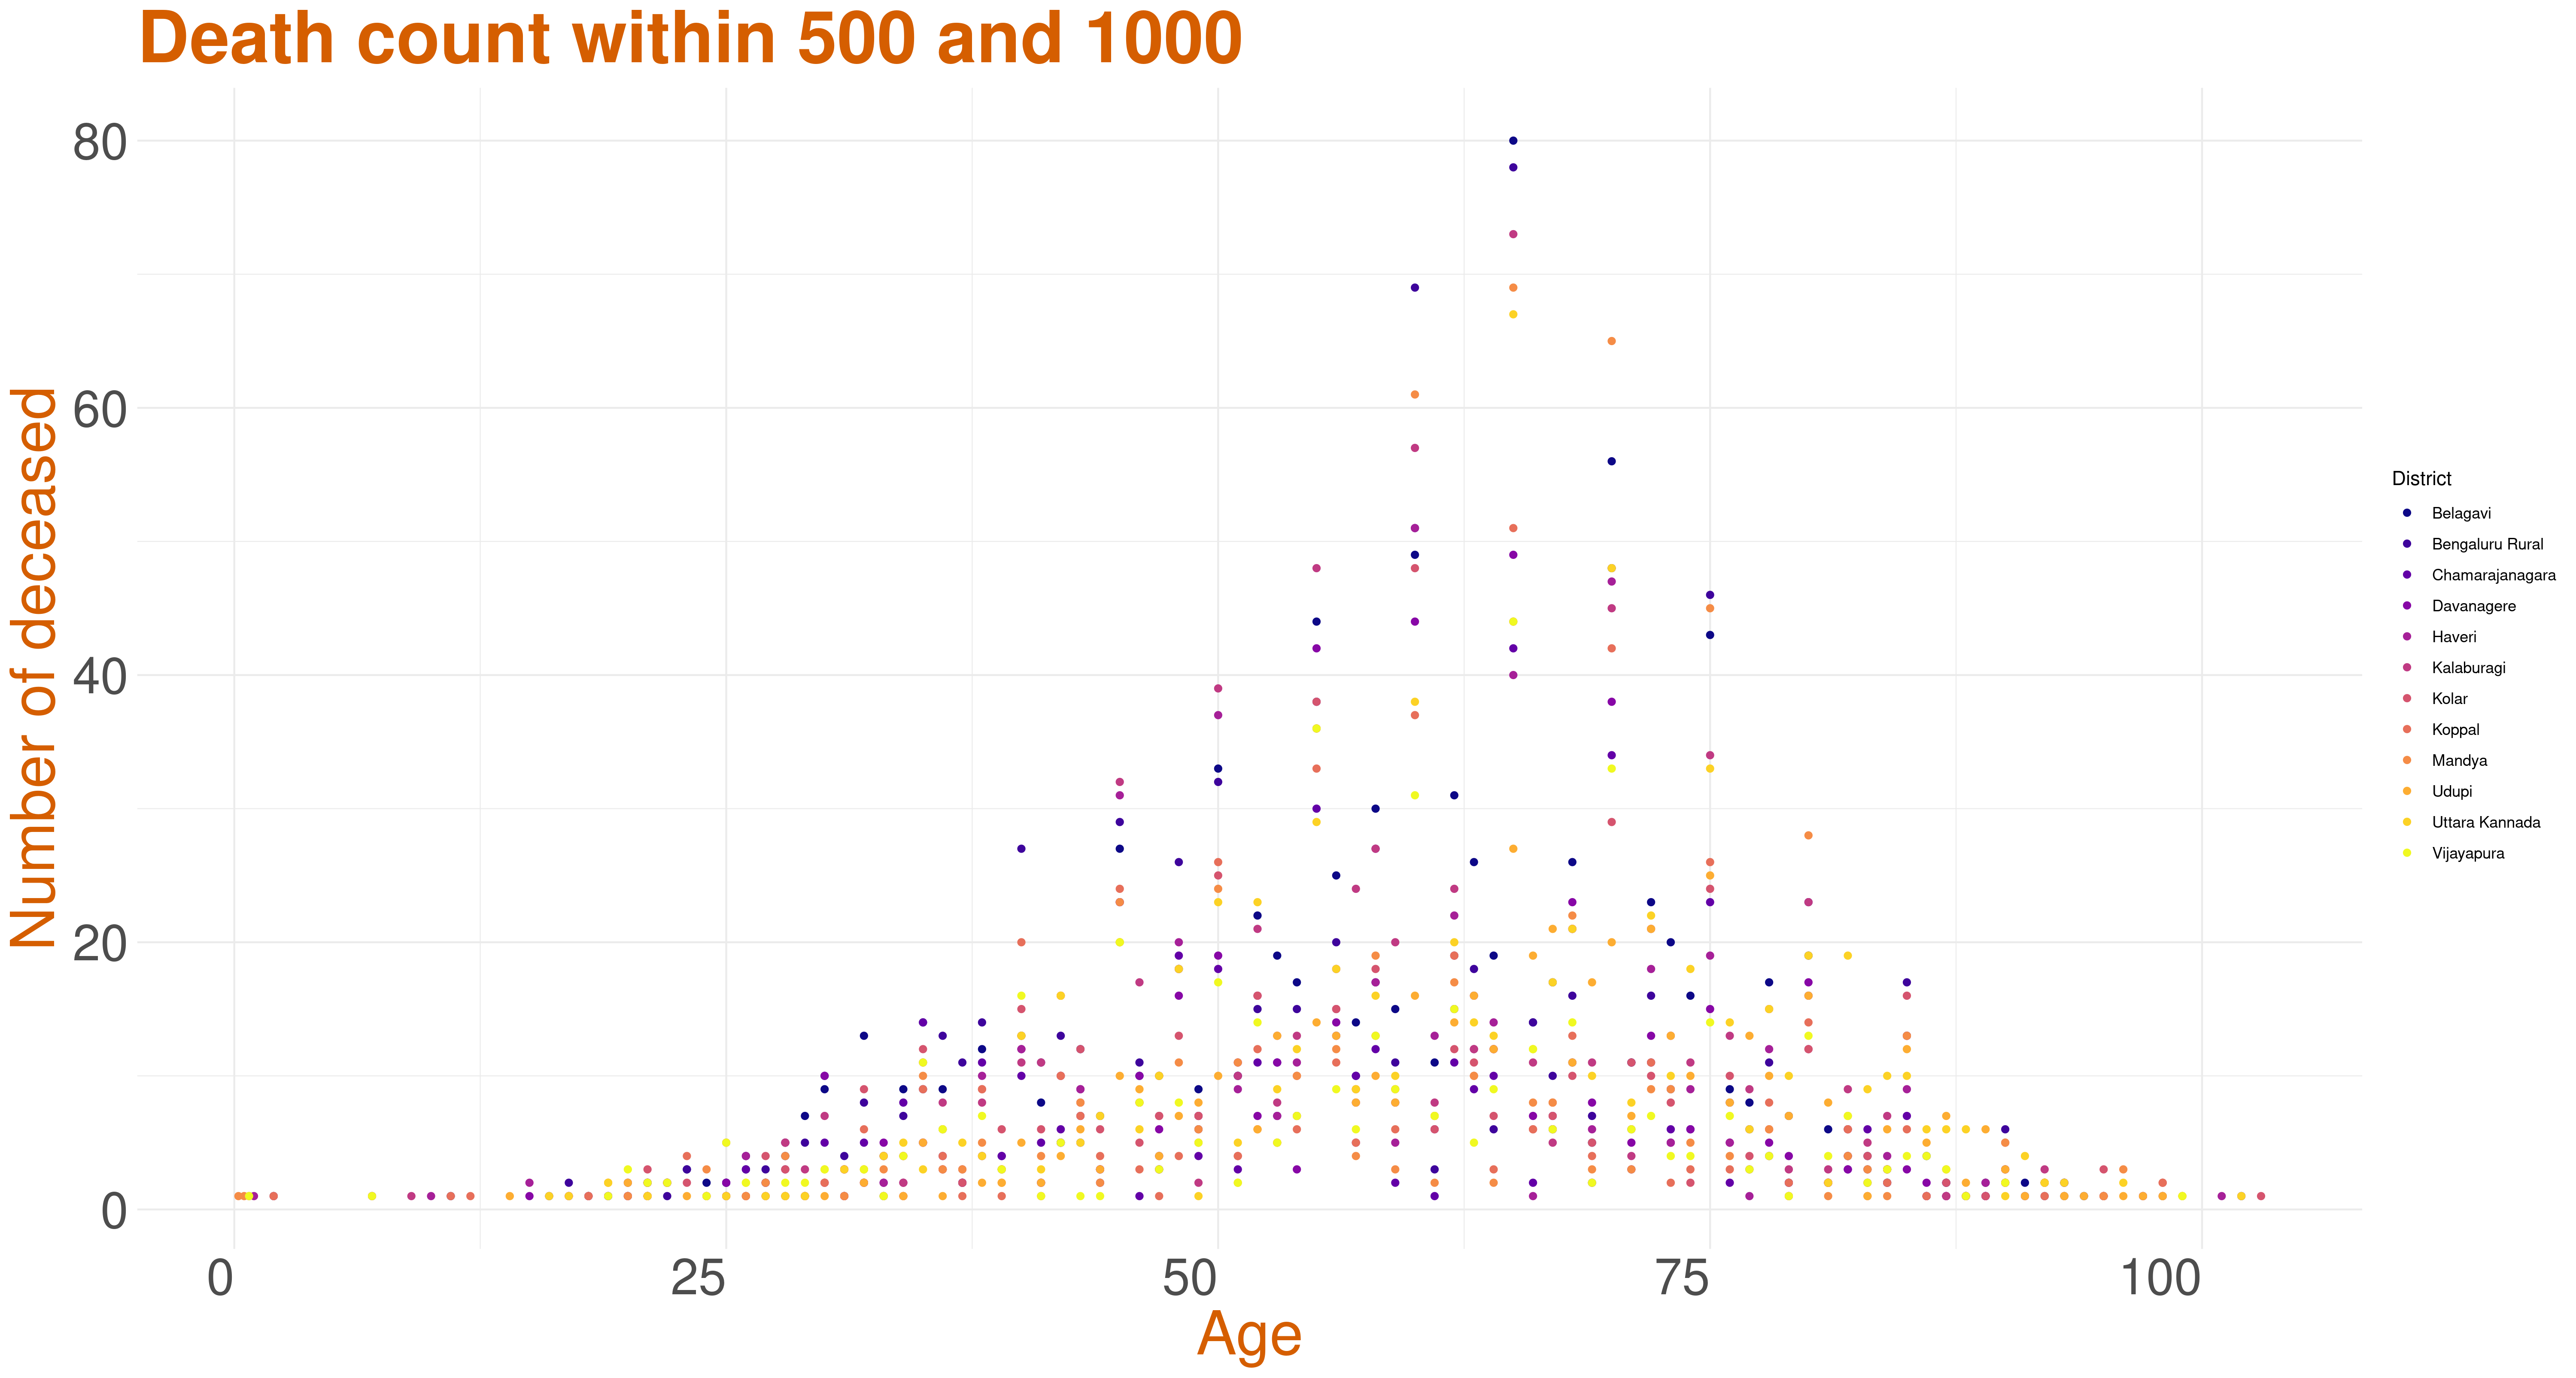
Analysis based on number of deceased across Districts
The death counts across every district till the present day is calculated and categorised into three groups based on their value as total death count being less than 500, total death count between 500 and 1000, and total death count being more than 1000. Then three separate scatter plots have been plotted for each of these groups as shown below.